Financial News Highlights
- China’s economy saw solid growth in the first quarter, with a strong rebound in consumption and exports after lockdowns were lifted at the end of last year.
- U.S. existing home sales fell by 2.4% month-on-month (m/m) in March, falling from February’s revised 13.8% m/m uptick as past mortgage rate increases weighed on demand.
- FOMC members noted that they continue to monitor credit conditions, but many seem to be in favor of further policy tightening at the next meeting in May.
Housing Falls as the Fed Blackout Period Begins
 As earnings season picked up pace this week, markets were closely attuned to the first quarter performance of U.S. companies in financial news. However, the net result on equity markets was muted, as results that were on aggregate moderately positive were partially overshadowed by the downbeat outlook for demand amid the expected economic slowdown later this year. As of the time of writing, the S&P 500 is down 0.5% on the week while the ten-year Treasury yield is up 5 basis-points (bps) to 3.57%.
On the global economic data front, we kicked off the week with first quarter Chinese GDP data, which grew by 4.5% from its year-ago level. The print was better than expected, as pent-up demand from consumers powered growth. China’s economic rebound is expected to be short-lived as consumer exuberance fades and structural headwinds continue to weigh on the economy in the back half of the year.
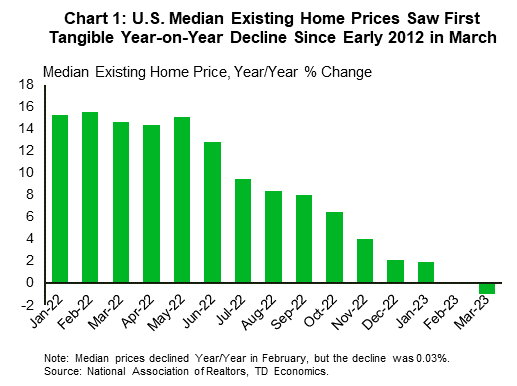
In the U.S. we had a housing-centric week for economic data, with updates on both existing home sales and residential construction. Data released on Thursday showed that existing home sales fell by 2.4% month-on-month (m/m) in March, pulling back from February’s revised 13.8% m/m increase. Month-to-month changes have been mirroring the volatility seen in mortgage rates (with a lag) as elevated prices have increased the reliance of buyers on financing conditions. While median home prices declined for a second consecutive month relative to year-ago levels (Chart 1), the seasonally adjusted change between February and March was slightly positive. Prices have been held up in part due to low inventory levels. However, new home construction is picking up, with single-family housing starts recovering for a second consecutive month in March, after eleven straight months of declines.
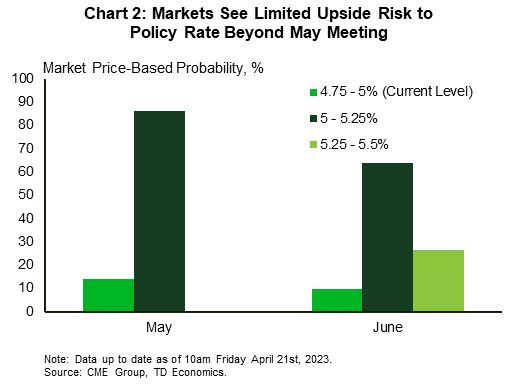 With the Federal Reserve’s pre-meeting blackout period starting on Saturday, we won’t hear from any FOMC members again until Chair Powell’s press conference on May 3rd. Luckily, we heard from ten Fed officials this week, six of whom are voting members. Most of the speakers noted that they were continuing to monitor credit conditions for signs of further stress. The Fed’s regional monitoring in April’s Beige Book stating that “several Districts noted that banks tightened lending standards amid increased uncertainty and concerns about liquidity” in financial news. Although this may aid the Fed in tightening credit conditions, as noted by Chicago Fed President Goolsbee this week, most members seemed to agree that further policy tightening would be required to sustainably return inflation to the Fed’s 2% target. As of the time of writing, markets are expecting the Fed to hike by 25bps in May, and then hold in June (Chart 2).
Next week we’ll get a first look at first quarter U.S. GDP and March PCE inflation, both of which are expected to show signs of cooling. Our forecast calls for activity to continue to slow through the remainder of 2023. This should help ease inflation pressures, enabling the Fed to keep the funds rate at 5.25% for the rest of the year.
Andrew Foran, Economist | 416-350-8927
This Financial News report is provided by TD Economics. It is for informational and educational purposes only as of the date of writing and may not be appropriate for other purposes. The views and opinions expressed may change at any time based on market or other conditions and may not come to pass. This material is not intended to be relied upon as investment advice or recommendations, does not constitute a solicitation to buy or sell securities and should not be considered specific legal, investment or tax advice. The report does not provide material information about the business and affairs of TD Bank Group and the members of TD Economics are not spokespersons for TD Bank Group with respect to its business and affairs. The information contained in this financial news report has been drawn from sources believed to be reliable but is not guaranteed to be accurate or complete. This report contains economic analysis and views, including about future economic and financial markets performance. These are based on certain assumptions and other factors and are subject to inherent risks and uncertainties. The actual outcome may be materially different. The Toronto-Dominion Bank and its affiliates and related entities that comprise the TD Bank Group are not liable for any errors or omissions in the information, analysis or views contained in this report, or for any loss or damage suffered.
To see more news reports, click here.