Financial News Highlights
- U.S. real GDP growth slowed to 1.1% quarter-over-quarter (q/q) annualized in 2023 Q1, from 2.6% q/q in the previous quarter. A measure of underlying domestic demand accelerated to 2.9% q/q, supported by a strong gain in consumer spending, although the monthly pattern revealed that the spending gain was entirely concentrated in January.
- New home sales grew by 9.6% month-on-month in March. While this series is volatile, it has been trending up since the end of last year.
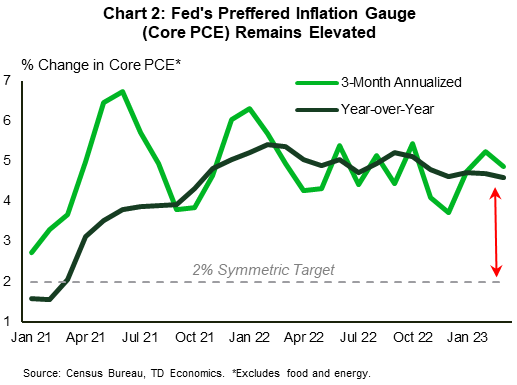
- Core PCE inflation remained elevated in March, easing modestly to 4.6% year-on-year from 4.7% in February.
Core Inflation Remains Elevated, Fed to Hike Next Week
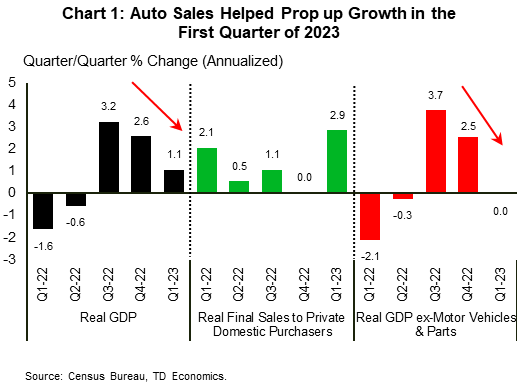 U.S. real GDP growth slowed to a 1.1% quarter-over-quarter (q/q) annualized pace in the first quarter of 2023, from 2.6% q/q at the end of 2022 in financial news. While consensus expectations were looking for a better print, a slowdown in growth was always in the cards as a reversal of the prior quarter’s inventory built-up was expected. That reversal materialized. Government spending, meanwhile, provided an offset, delivering a 0.8 percentage point (pp) contribution to growth. With the combined impact of inventories and government spending adding volatility to the data, we typically look past these items and focus on ‘final sales to private domestic purchasers’ to get a clearer reading of underlying domestic demand. After several quarters of slow growth, this measure accelerated to 2.9% q/q, supported by a strong gain in consumer spending (+3.7%).
At face value, the acceleration in underlying domestic demand is good news. However, monthly spending data shows that the strength was concentrated in January, with growth flatlining over the next two months. Much of the quarter’s strength came from auto sales. Unit auto sales grew from 14.3 million (annualized) at the end of 2022, to 15.3 million in 2023 Q1, resulting in a 1.1 (pp) contribution to GDP. If we remove that impact, the rest of the economy recorded zero growth (Chart 1). While our forecast calls for motor vehicles sales to remain at a high level over the near-term, as pent-up demand is satiated by improved production (see here), this channel is unlikely to offer the same level of support in 2023 Q2.
 Residential investment remained a growth detractor for the eight consecutive quarter, but its negative impact moderated noticeably as average declines of 26% q/q in the second half of 2022 eased to 4.2% q/q in 2023 Q1. We expect residential investment to be less of a drag this year, a message echoed by some moderate positive signals out of the housing market. New home sales, a volatile series, continue to trend up since the end of last year, rising 9.6% month-on-month in March. This is happening as tight supply conditions on the existing home market look to be driving some more action towards the new home market. That said, with housing affordability still exceptionally low, buyers are showing increased sensitivity to mortgage rates (though with the typical lag). An index tracking the number of contracts signed to purchase existing homes, a reliable indicator of closed sales, fell 5.2% in March amidst an uptrend in mortgage rates earlier in the month in financial news. The stress in regional banking is also likely to have contributed to the hesitation among buyers to sign housing contracts.
In weighing the Fed’s next interest rate decision, the latest PCE report showed that the Fed’s preferred inflation gauge remained elevated in March. While overall PCE slowed noticeably to 4.2% year-on-year (y/y), from 5.1% in the month prior, core PCE eased only modestly to 4.6% y/y (Chart 2). In our view, core PCE inflation has a long way to return to target (see here). As such, we expect the Fed to hike by 25 basis points next week and keep the policy rate at that high level through the end of the year.
Admir Kolaj, Economist | 416-944-6318
This Financial News report is provided by TD Economics. It is for informational and educational purposes only as of the date of writing and may not be appropriate for other purposes. The views and opinions expressed may change at any time based on market or other conditions and may not come to pass. This material is not intended to be relied upon as investment advice or recommendations, does not constitute a solicitation to buy or sell securities and should not be considered specific legal, investment or tax advice. The report does not provide material information about the business and affairs of TD Bank Group and the members of TD Economics are not spokespersons for TD Bank Group with respect to its business and affairs. The information contained in this financial news report has been drawn from sources believed to be reliable but is not guaranteed to be accurate or complete. This report contains economic analysis and views, including about future economic and financial markets performance. These are based on certain assumptions and other factors and are subject to inherent risks and uncertainties. The actual outcome may be materially different. The Toronto-Dominion Bank and its affiliates and related entities that comprise the TD Bank Group are not liable for any errors or omissions in the information, analysis or views contained in this report, or for any loss or damage suffered.
To see more news reports, click here.