HIGHLIGHTS OF THE WEEK
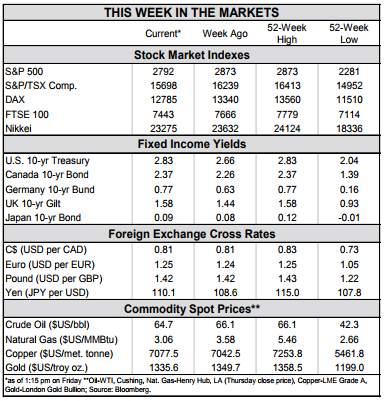
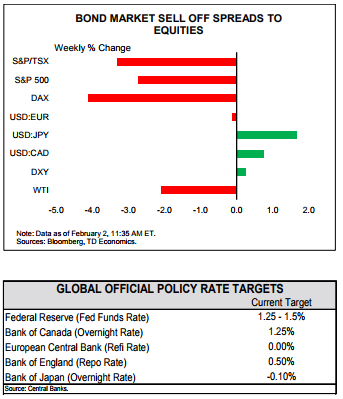
- Another week, another sell-off in the bond market. As of the time of writing the U.S. 10-year yield stood at over 2.8%, up more than 10 basis points from the end of last week.
- U.S. payrolls expanded by 200k in January while the unemployment rate remained steady at 4.1%. The big story though was the acceleration in wage growth. Average hourly earnings growth hit 2.9% year-on-year, up from 2.6% and the fastest growth since 2009.
- Recent economic data cement the case for the Federal Reserve to raise interest rates at its next meeting in March. Expect at least another two rate hikes from the Powell-led Fed before the end of 2018.

Faster Growth + Inflation = Higher Bond Yields

The rise in yields is both a real growth and inflation story. On the real side, the sell-off has come as the median Bloomberg forecast for 2018 real GDP moved up 30 basis points to 2.6%, from 2.3% last October. Undoubtedly, tax cuts played a role. The biggest increases came as they were announced and then passed into law.
On the inflation side, market-based measures of inflation expectations have also moved up. The five-year forward inflation rate (an indicator of expectations for inflation five-to-ten years from now) has moved up over 20 basis points since the start of the year (Chart 1). Tax cuts are expected to push economic growth further above its trend rate and also increase the supply of Treasury securities, even as the economy approaches full employment.
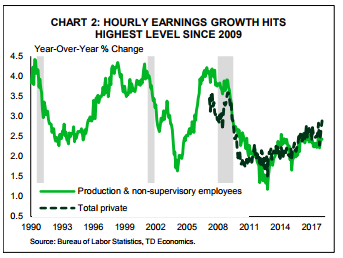
The acceleration in wage growth will come as a relief to believers in the Phillips curve, giving credence to the notion that as workers become scarce, the wages offered to attract and retain them should rise. At the same time, recent data have also shown the importance of “shadow slack.” While the unemployment rate has been fairly steady, the employment to population ratio of 25 to 54 year olds has moved higher (it edged down ever so slightly in January to 79.0% from a cycle high of 79.1%). Still, its steady improvement is more consistent with the gradual rise in wage growth than the unemployment rate alone.
The increase in bond yields over the start of 2018 makes sense given these cyclical dynamics. Still, we would caution about extrapolating recent moves much further going forward. While the economic data support an ongoing expansion, the structural forces weighing on interest rates have not changed. Population aging will continue to exert downward pressure on the economy’s trend growth rate and the terminal (or neutral) level of the federal funds fate. At the same time, continued pressure on global bond yields from elevated debt levels and structural impediments to growth will keep a lid on U.S. yields.
All told, economic data and fiscal policy developments cement the case for the Federal Reserve to continue to normalize policy. Still, with a neutral rate in the neighborhood of 2.5%, three hikes in 2018 should be more than sufficient to keep a lid on inflation and allow any remaining labor market slack to be absorbed.
James Marple, Senior Economist
This report is provided by TD Economics. It is for informational and educational purposes only as of the date of writing, and may not be appropriate for other purposes. The views and opinions expressed may change at any time based on market or other conditions and may not come to pass. This material is not intended to be relied upon as investment advice or recommendations, does not constitute a solicitation to buy or sell securities and should not be considered specific legal, investment or tax advice. The report does not provide material information about the business and affairs of TD Bank Group and the members of TD Economics are not spokespersons for TD Bank Group with respect to its business and affairs. The information contained in this report has been drawn from sources believed to be reliable, but is not guaranteed to be accurate or complete. This report contains economic analysis and views, including about future economic and financial markets performance. These are based on certain assumptions and other factors, and are subject to inherent risks and uncertainties. The actual outcome may be materially different. The Toronto-Dominion Bank and its affiliates and related entities that comprise the TD Bank Group are not liable for any errors or omissions in the information, analysis or views contained in this report, or for any loss or damage suffered.