FINANCIAL NEWS HIGHLIGHTS OF THE WEEK
- US retail sales rose by 0.9% m/m, while the control group grew by a stronger 1% m/m. Revisions to the month prior were also positive, suggesting Q1 spending ended the quarter on a firmer footing.
- Home sales fell by 2.6% m/m to 5.6M units in April, as deteriorating affordability continues to weigh on demand. Housing starts (-0.2% m/m) also recorded a modest decline but remain at a healthy 1.7M units.
- Inflation continued to accelerate across the G-7 into April as the effects of rising food and energy prices continue to be felt.
- Moving forward, higher interest rates and reduced real disposable incomes will weigh on demand and help to cool inflation by narrowing the wedge between demand and supply.
U.S. -Spending Through the Pain
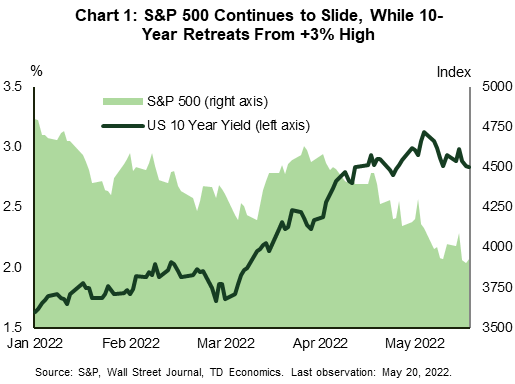
US equities extended one of their worst losing streaks since 2008 this week, having now recorded seven consecutive weeks of declines in financial news. At the time of writing, the S&P 500 is down 2% on the week, and a far greater 18% year-to-date. The selloff in stocks fueled a rally in US treasuries, pushing the 10-year yield down by 10 basis points to 2.83% (Chart 1).
Sentiment soured early in the week as U.S. brick-and-mortar retailers drastically cut future earnings expectations. The common theme was that they are struggling with higher inflation, wages pressures and rising freight costs, all of which are cutting into profits. The dour reaction from financial markets appears to be rooted in the growing concern that the US economy is on the verge of a recession. Investors interpreted the disappointing earnings as a sign that consumers are already on a more precarious footing, further fanning the recession rhetoric. We see things a bit differently.
For starters, many of these big box retailers operate in an environment where margins have always been relatively thin. Even in “normal times”, their ability to pass-on higher costs to consumers is quite limited given the competitive nature of the retail landscape. This problem has been heightened of late, as retailers moved to replenish severely depleted inventories late last year even as consumer demand was already pivoting from goods in favor of services. Retailers were left holding significant inventory, forcing them to discount some merchandise, cutting further into profits.
Retail sales data for April corroborate the notion that consumer spending remains healthy. Headline sales were up 0.9% month-on-month (m/m), while the control measure was up an even stronger 1% m/m. Removing the effects of inflation from the control group did little to change the story, as real sales rose by a healthy 0.9% m/m. Revisions to the prior month were also positive, suggesting consumer expenditures ended last quarter on a much firmer footing than previously thought. While spending is expected to remain robust over the near-term, the combination of higher interest rates and persistent inflationary pressures will present a material headwind in the second half of this year and into 2023. Spending is expected to moderate to a sub-2% pace, though remain supportive of underlying economic growth.

Outside of consumer spending, higher interest rates continue to weigh on housing demand. Existing home sales fell for the third consecutive month in April, falling by 2.4% m/m to 5.6M units (Chart 2). Inventory remained incredibly tight, though the pullback in sales did allow supply to nudge a touch higher to 2.2 months – from 2 months in March. Even still, the market remains undersupplied, which is helping to sustain double-digit price growth of 14.8% y/y.
Housing supply relief is coming, but it is taking longer than expected to come to market in other financial news. Despite recording a modest pullback in April, housing starts remained at a healthy 1.7 million units, while permitting activity continues to point to further gains in construction activity in the months ahead. The combination of softening demand and increased supply should go a long way in rebalancing the market over the coming months, and better align price growth to underlying fundamentals.
Thomas Feltmate, Director | 416- 944-5730
Global- Energy Prices Eat into Buying Power
It’s inflation week in the G-7 as the European Union, the U.K., Canada, and Japan all released detailed April inflation numbers. The U.K. made headlines as the consumer price index (CPI) measure reached an eye-watering 9.0% year-over-year (y/y) – the broader measure that includes home ownership services advanced by a more modest 7.8%. Even in Japan inflation hit a seven and a half year high as headline CPI growth reached 2.5%. In general, the surge in energy prices is the rising tide that is lifting the cost of living at a multi-decade high pace.
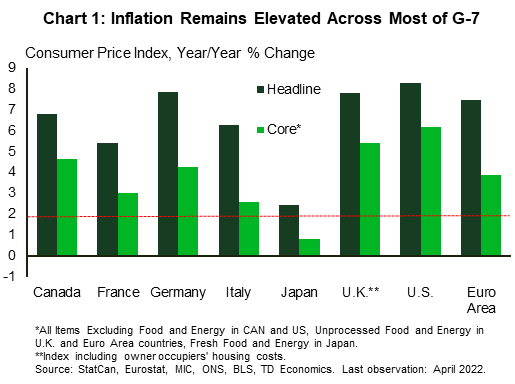
Headline CPI for April in the euro area was 7.3% y/y, while the measure excluding food and energy moved to 3.8%. By comparison, the U.S. registered 8.3% headline and 6.2% core advances, while Canada’s release this week showed a 6.8 % and 4.6% increase (Chart 1). The magnitude of the energy shock Europe is witnessing now can’t be understated. Energy prices are up 37.5% y/y, 7.3 percentage points ahead of the U.S. and a whopping 11.1 percentage points more than Canada. In the U.K., April saw the semi-annual adjustment to price caps on retail energy products. The cap increase produces abrupt jumps in energy costs followed by relative lulls (like a staircase) that ultimately tracks with the smoother European price profile (Chart 2).

That said, core measures (excluding food and energy) of inflation in most of the G-7 countries are well ahead of policymakers’ targets. This reflects demand continuing to outstrip supply as the global economy reckons with a sequence of supply-side shocks.
As inflation continues to accelerate central bankers are concerned about longer-term inflation expectations rising and the entrenchment of a wage-price spiral in financial news. That’s a key part of the reason why they continue to signal more monetary tightening despite the risk of a slowdown in growth.
Higher interest rates will work to weaken demand growth, albeit with a lag. The effect of inflation on purchasing power will be more immediate. Measures of wages in the U.K. and Europe are not keeping up with inflation. Average weekly earnings in the U.K. (adjusting for purchasing power) are up 3.5% y/y but, when bonuses are excluded, underlying real wages are down 2.0%. Euro area measures are released with a significant lag, but collectively bargained pay in Germany and Italy (which generally track underlying wage growth) are also lagging inflation. Notably, real hourly contractual wages in Japan were up 1.3% in March. However, in general, wage growth is not keeping up with inflation, so consumers will either be tapping accumulated savings or scaling back on purchases.
Moving forward, output growth will slow through the latter half of the year as inflation and higher interest rates erode purchasing power and slow expenditures. The softer demand backdrop will also help to cool inflation as the wedge between demand and supply narrows in further financial news.
Andrew Hencic, Senior Economist | 416-944-5307
This Financial News report is provided by TD Economics. It is for informational and educational purposes only as of the date of writing and may not be appropriate for other purposes. The views and opinions expressed may change at any time based on market or other conditions and may not come to pass. This material is not intended to be relied upon as investment advice or recommendations, does not constitute a solicitation to buy or sell securities and should not be considered specific legal, investment or tax advice. The report does not provide material information about the business and affairs of TD Bank Group and the members of TD Economics are not spokespersons for TD Bank Group with respect to its business and affairs. The information contained in this report has been drawn from sources believed to be reliable but is not guaranteed to be accurate or complete. This report contains economic analysis and views, including about future economic and financial markets performance. These are based on certain assumptions and other factors and are subject to inherent risks and uncertainties. The actual outcome may be materially different. The Toronto-Dominion Bank and its affiliates and related entities that comprise the TD Bank Group are not liable for any errors or omissions in the information, analysis or views contained in this report, or for any loss or damage suffered.