

Financial News for the Week of October 16th 2026
Financial News Highlights
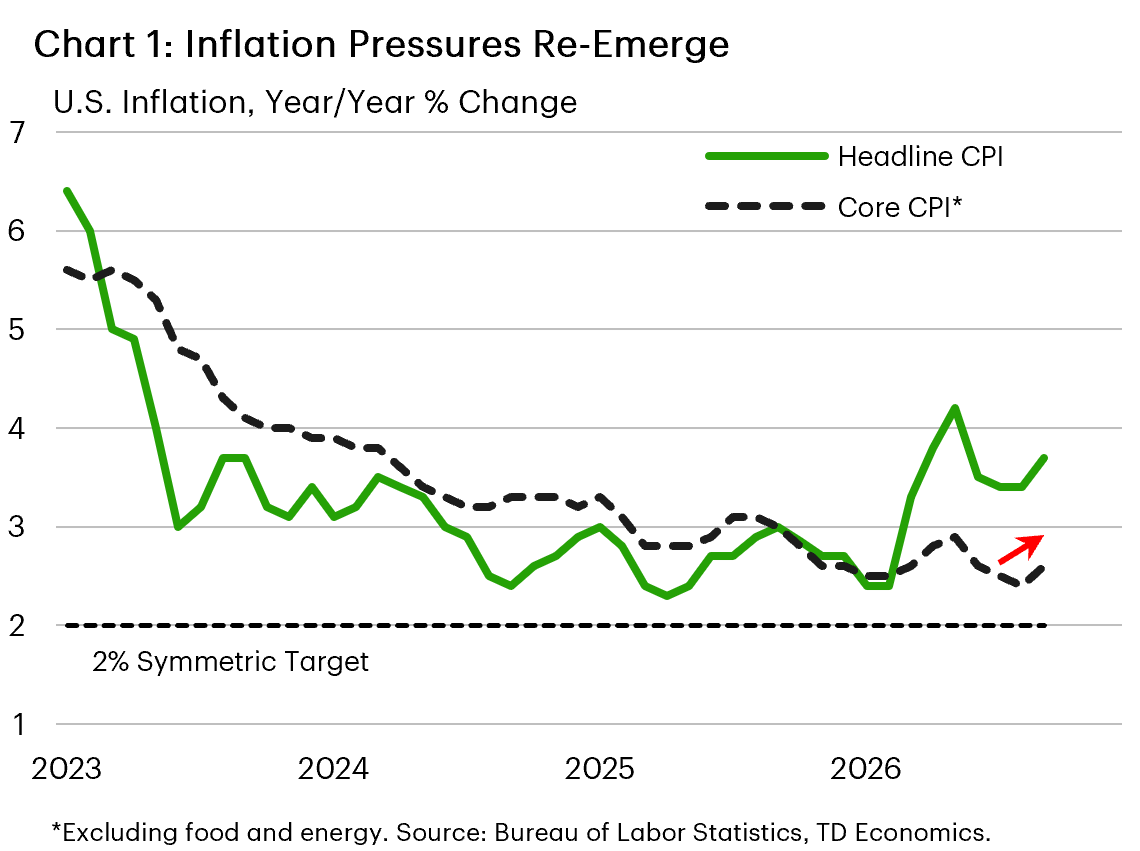
- Evidence of building price pressures was everywhere this week. Headline and core CPI inflation accelerated to 3.7% and 2.6%, respectively, while NFIB, Beige Book and producer-price data also pointed to building pressures.
- Gas prices helped lift retail sales 0.8% in September. Under the surface though, gains were broad-based and healthy spending at bars and restaurants showed consumers remain willing to spend in discretionary areas.
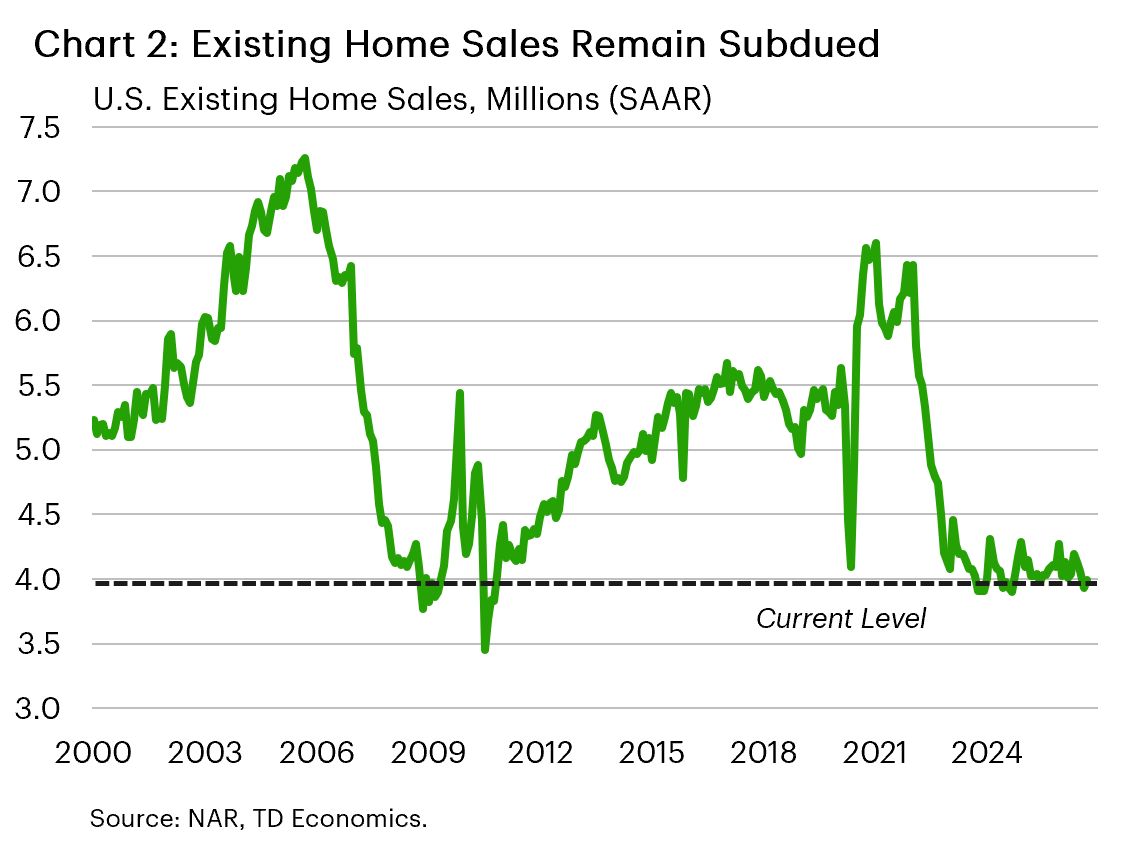
- Existing home sales remained subdued in September. Sales edged 1.5% higher, but remain near the four-million mark, with poor affordability continuing to weigh on transaction activity.
Price Pressures Strengthen the Case for Another Hike
It was a busy week on the U.S. economic calendar, with the latest data pointing to solid economic momentum, but elevated inflation pressures. U.S. equities look to end the week in the red, as a hotter inflation report led to a significant AI-related selloff amid growing concerns that elevated interest rates could pose funding challenges and slow the AI buildout. Meanwhile, the 10-year Treasury yield retreated to just under 5.1% after briefly climbing above 5.3% earlier in the week. The pullback appeared to reflect a flight to safety rather than easing inflation concerns.
Retail spending held up in September, rising 0.8% on the month, following a 1.3% gain in August. While higher gasoline prices helped to boost the headline figure, gains were relatively broad-based with 8 of 13 retail segments recording higher sales on the month. Moreover, spending at bars and restaurants remained healthy, suggesting consumers remain willing to spend in discretionary areas. Elsewhere, initial jobless claims remained low and range-bound, while the Federal Reserve’s Beige Book reported little change in employment, pointing to continued labor market stability.
The inflation details were less reassuring. Headline CPI rose 0.6% m/m in September as higher energy prices pushed year-on-year inflation to 3.7%. Core inflation held at 0.3% m/m, disappointing expectations for some cooling, and accelerated to 2.6% year-on-year (Chart 1). Price pressures built across several categories, with firmer readings across core goods, shelter and non-housing services. The share of small businesses citing inflation as their most important problem picked up in September, while the Beige Book also pointed to some broadening in price pressures. Producer prices reinforced the message, surging 1.3% m/m and 6.3% year-on-year in September. These firmer inflation readings strengthened the case for additional tightening, though markets see December as the more likely timing for the next hike rather than October.
Higher rates are already weighing on interest-sensitive sectors, such as housing. Existing home sales ticked higher in September, but the improvement came off a downwardly revised August reading and activity remained subdued near the four-million mark (Chart 2). Inventory improved a little, with the months’ supply rising to 4.6. Still, the recent surge in mortgage rates will make September’s modest sales gain difficult to sustain. The average 30-year fixed mortgage rate has eased from 7.6% earlier this month, but remains above 7.3%. The roughly 130-basis-point increase from late-February levels of 6% adds about $300 to the monthly mortgage payment on a typical single-family home, weighing on affordability.
Overall, this week’s data depict an economy that remains on a decent footing. However, with inflationary pressures elevated and demand remaining resilient, further policy action will be required from the Fed before year-end. Given the recent wave of Fed speak downplaying the urgency of delivering back-to-back hikes, it seems more likely that the FOMC will opt to skip October and hike again in December.
Admir Kolaj, Economist | 416-944-6318
This Financial News report is provided by TD Economics. It is for informational and educational purposes only as of the date of writing and may not be appropriate for other purposes. The views and opinions expressed may change at any time based on market or other conditions and may not come to pass. This material is not intended to be relied upon as investment advice or recommendations, does not constitute a solicitation to buy or sell securities and should not be considered specific legal, investment or tax advice. The report does not provide material information about the business and affairs of TD Bank Group and the members of TD Economics are not spokespersons for TD Bank Group with respect to its business and affairs. The information contained in this financial news report has been drawn from sources believed to be reliable but is not guaranteed to be accurate or complete. This report contains economic analysis and views, including about future economic and financial markets performance. These are based on certain assumptions and other factors and are subject to inherent risks and uncertainties. The actual outcome may be materially different. The Toronto-Dominion Bank and its affiliates and related entities that comprise the TD Bank Group are not liable for any errors or omissions in the information, analysis or views contained in this report, or for any loss or damage suffered. Do you have any questions about your finances? As financial advisors in Cornelius NC, Naples FL, and Moultonborough NH we are happy to help.
To see more news reports, click here.


Financial News for the Week of October 9th 2026
Financial News Highlights
- Oil prices remained volatile as markets weighed shifting Middle East tensions, improved flows through the Strait of Hormuz, and hurricane-related production shutdowns in the Gulf.
- U.S. Treasury yields edged lower as healthy demand at 10- and 30-year auctions helped ease pressure from the recent rise in term premiums.
- Financial markets remained confident that the Fed would hold rates at their next meeting, though next week’s CPI report will be monitored closely.
U.S. Treasuries Stabilize as Oil Prices Oscillate
The first full week of the third quarter was relatively light on economic data releases. WTI oil prices oscillated between $88-93/barrel this week, as markets weighed reports regarding improved oil flows through the Strait of Hormuz and conflicting reports about the status of geopolitical tensions in the region. The first Atlantic hurricane of the year, Hurricane Isaias, has also provided a modest boost to oil prices as its path through the Gulf toward Alabama and the Florida panhandle has resulted in temporary shutdowns covering 1.3 million barrels per day.
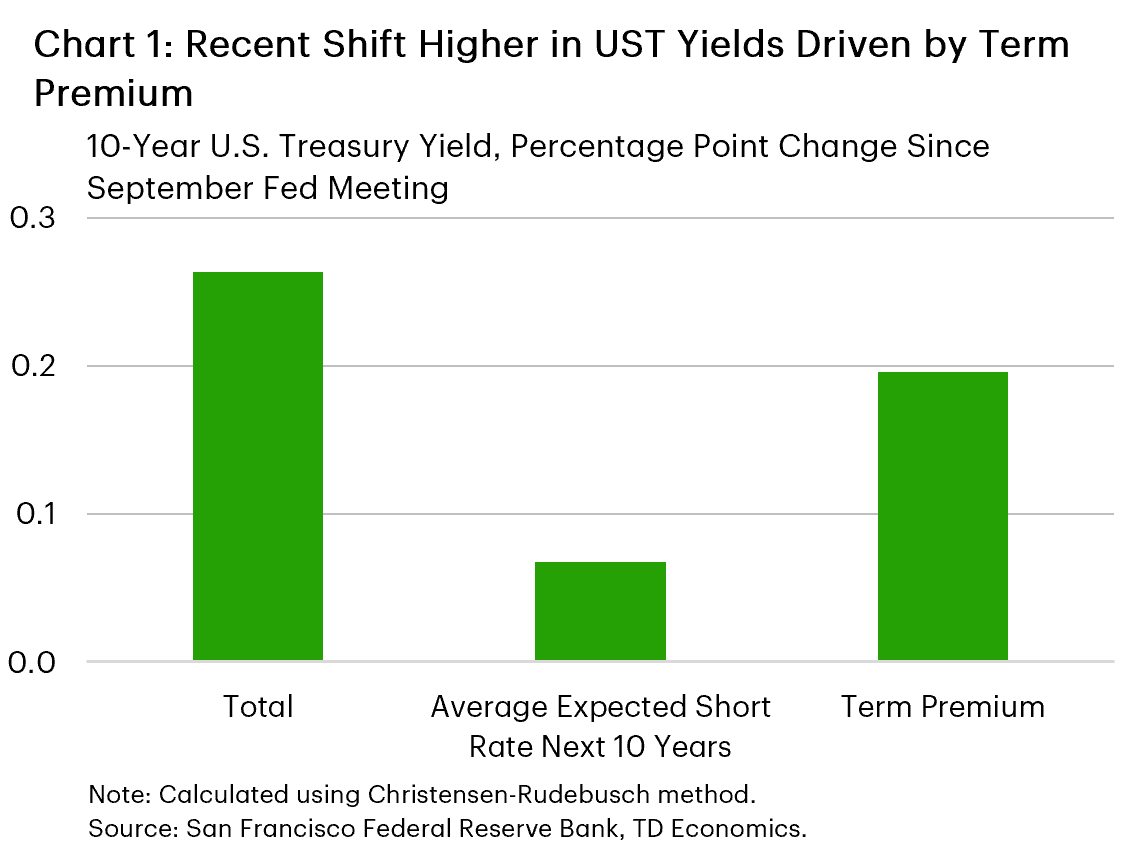
In credit markets, the march higher in global government bond yields eased over the past week. While concerns regarding the confluence of high national debt levels and higher for longer interest rates remain, U.S. Treasury auctions for 10-and 30-year bonds showed that investor demand remained healthy in the primary market. Given that most of the uptick in U.S. Treasury yields since the Federal Reserve’s September meeting has been a function of the risk premium (Chart 1) – the additional compensation demanded by investors to hold federal government debt – this development helped to alleviate some of the pressure on the U.S. Treasury market.
In terms of the economic data that we did receive this week, the advance estimates for international trade in August showed that the U.S. trade deficit widened to its highest level since March 2025 – the period that saw significant front-loading of imports in advance of the implementation of global tariffs. Surging imports of AI-related products continued to be the central catalyst of this trend, which more than offset the boost to nominal exports from higher energy prices. Elsewhere, the ISM Services index showed that service-based businesses continued to expand in September, albeit at a slower pace. Notably, the prices paid index hit its highest level since July 2022, illustrating the sustained pressure on input costs for businesses.
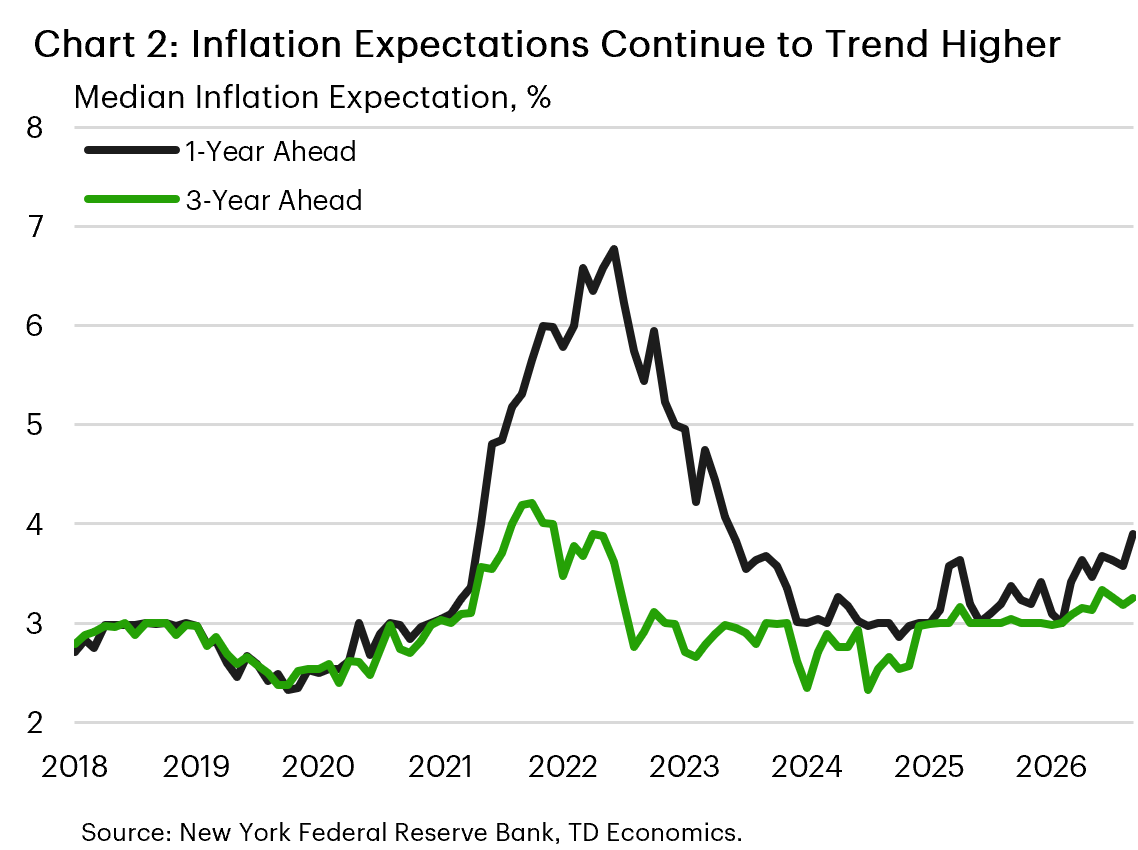
This remains a concern for the Federal Reserve, as noted in the release of the September meeting minutes this week. Committee members cited several risks to the inflation outlook, including persistent core inflation, higher energy prices, significant investment activity related to AI, and possible tariff increases. Consumers appeared to be of a similar mind, with the median 1-year ahead expectation for inflation hitting its highest level in over three years in September – just under 4% (Chart 2).
We’ll get a first look at September inflation next week when the CPI report is released on Wednesday. Consensus expectations are calling for an acceleration in total inflation, but a modest deceleration in core inflation in terms of the monthly change. If the data comes in as expected, then it will likely confirm market expectations for the Fed to refrain from raising rates at their next meeting at the end of the month. However, a material upside surprise could put the meeting back in play for a hike, with the overall bias of the FOMC remaining cautiously hawkish.
Andrew Foran, Economist | 416-350-8927
This Financial News report is provided by TD Economics. It is for informational and educational purposes only as of the date of writing and may not be appropriate for other purposes. The views and opinions expressed may change at any time based on market or other conditions and may not come to pass. This material is not intended to be relied upon as investment advice or recommendations, does not constitute a solicitation to buy or sell securities and should not be considered specific legal, investment or tax advice. The report does not provide material information about the business and affairs of TD Bank Group and the members of TD Economics are not spokespersons for TD Bank Group with respect to its business and affairs. The information contained in this financial news report has been drawn from sources believed to be reliable but is not guaranteed to be accurate or complete. This report contains economic analysis and views, including about future economic and financial markets performance. These are based on certain assumptions and other factors and are subject to inherent risks and uncertainties. The actual outcome may be materially different. The Toronto-Dominion Bank and its affiliates and related entities that comprise the TD Bank Group are not liable for any errors or omissions in the information, analysis or views contained in this report, or for any loss or damage suffered. Do you have any questions about your finances? As financial advisors in Cornelius NC, Naples FL, and Moultonborough NH we are happy to help.
To see more news reports, click here.

Financial News for the Week of October 2nd 2026
Financial News Highlights
- Annual revisions strengthened the economy’s growth profile and softened its inflation history, with firmer private demand alongside cooler underlying core PCE momentum.
- The jobs report delivered a more benign signal than the headline payroll miss suggested: hiring slowed but remained close to the labor market’s breakeven pace, while unemployment edged higher as more workers entered the labor force.
- Improved inflation trends alongside softer hiring and wage growth reduce the urgency of an October hike.
Hot and Cold
Wall Street spent another week discovering that a resilient economy does not guarantee life is simple or easy. Treasury yields remained elevated as oil prices, inflation concerns and expectations for another Federal Reserve hike outweighed an otherwise encouraging run of economic data. The broad message was awkwardly balanced: the economy is growing more quickly than previously estimated, underlying inflation has cooled more than previously thought, and the next wave of cost pressures is already appearing. Higher long-term yields tightened financial conditions in real time and kept equities on the defensive.
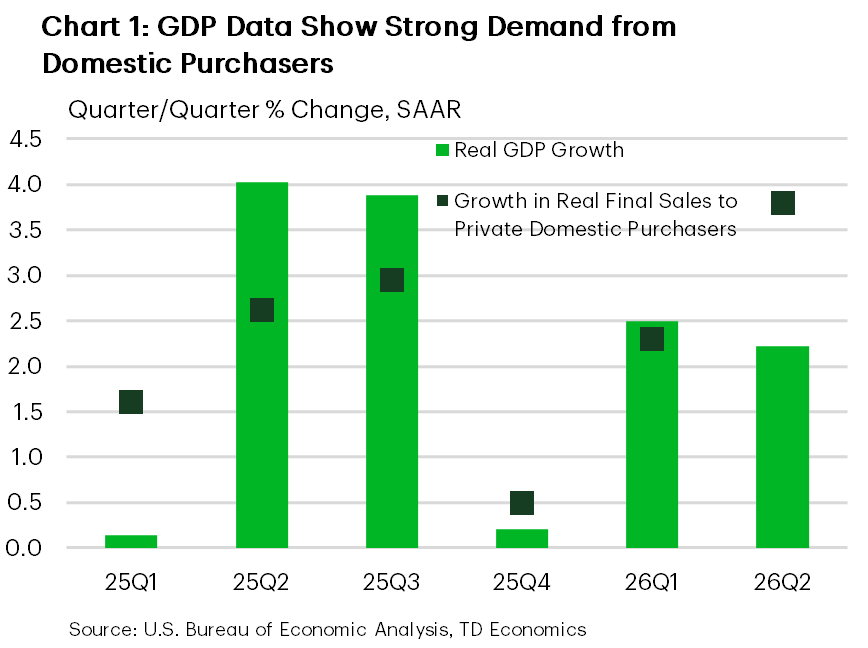
Wednesday’s annual update did more than lift the GDP numbers—it revealed that the economy had been running on a stronger engine than previously understood. The clearest signal came from real final sales to private domestic purchasers, which advanced at a robust 4.6% pace in Q2 (Chart 1). By stripping out inventories, trade and government spending, this measure showed that the resilience was rooted in household and business demand, not statistical noise or temporary supports. At the same time, the revisions lowered the recent inflation profile, giving the Fed a better combination of growth and price performance in hindsight. But hindsight is the key word: the revisions rewrote the economy’s past, but they do not guarantee its future. The revisions show that demand entered the current period from a position of strength but cannot speak to whether it can withstand elevated yields and cost pressures.
Other data this week, including spending and manufacturing reports, told a similar growth story, but with less comfortable inflation implications. Real consumer spending jumped 0.6% in August, its strongest monthly gain since March 2025, even as income lagged and the saving rate slipped to 4.1%. Consumers sounded glum in the confidence survey but kept spending, a familiar gap between what households say and what they do. Manufacturers were similarly busy. The ISM index held at a healthy 54.5 as new orders, backlogs and employment improved. But the catch was prices: the input-cost index surged as firms cited tariffs, metals and petroleum costs. The takeaway is that while demand is holding up, price pressures are building upstream.
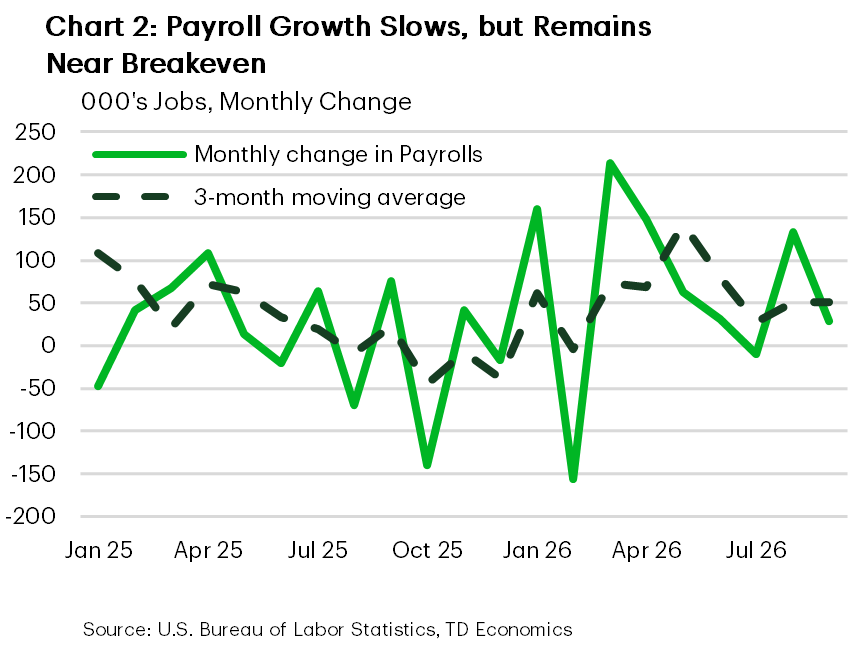
Payrolls rose by just 29,000 in September and prior months were revised lower, but the three-month average remained near the pace needed to keep the unemployment rate roughly stable (Chart 2). The slight rise in the unemployment rate was also less troubling than it appeared: it reflected a stronger expansion in the labor force than in household employment, with participation moving higher. Wage growth cooled further, easing concern that the labor market is adding to inflation pressure. Taken together, the report points to a labor market that is moderating without coming apart. Alongside softer PCE inflation and lower historical price estimates, that reduces the urgency for the Fed to hike again in October. The meeting remains live, with another CPI report still to come, but policymakers now have more room to wait.
Vikram Rai, Senior Economist | 416-923-1692
This Financial News report is provided by TD Economics. It is for informational and educational purposes only as of the date of writing and may not be appropriate for other purposes. The views and opinions expressed may change at any time based on market or other conditions and may not come to pass. This material is not intended to be relied upon as investment advice or recommendations, does not constitute a solicitation to buy or sell securities and should not be considered specific legal, investment or tax advice. The report does not provide material information about the business and affairs of TD Bank Group and the members of TD Economics are not spokespersons for TD Bank Group with respect to its business and affairs. The information contained in this financial news report has been drawn from sources believed to be reliable but is not guaranteed to be accurate or complete. This report contains economic analysis and views, including about future economic and financial markets performance. These are based on certain assumptions and other factors and are subject to inherent risks and uncertainties. The actual outcome may be materially different. The Toronto-Dominion Bank and its affiliates and related entities that comprise the TD Bank Group are not liable for any errors or omissions in the information, analysis or views contained in this report, or for any loss or damage suffered. Do you have any questions about your finances? As financial advisors in Cornelius NC, Naples FL, and Moultonborough NH we are happy to help.
To see more news reports, click here.

Financial News for the Week of September 25th 2026
Financial News Highlights
- The global bond selloff intensified this week, with the 10-year Treasury yield reaching a new 19-year high.
- A proposed 90-day diesel export ban could lower domestic prices, but also curb refinery output and raise gasoline and global fuel costs.
- This week’s Fed speeches were notably unified, with all officials striking a hawkish tone amid signs that domestic activity is strengthening.
Resilient Growth Keeps the Fed on Edge
The global bond selloff intensified this week, with the U.S. 10-year Treasury yield reaching a 19-year high of 5.22%. The rout reflected a confluence of factors: strong PMI data pointing to resilient growth and persistent inflation pressures, hawkish Fed commentary, and lackluster demand at a five-year Treasury auction. Geopolitical developments added to the uncertainty. Iran’s president told the UN General Assembly that reopening the Strait of Hormuz remained conditional on the U.S. lifting its blockade on Iranian exports, dashing hopes for any near-term diplomatic breakthrough. Even so, oil prices fell 6% on the week to $94 per barrel as Saudi Arabia resumed operations on its East-West Pipeline – a key artery that transports roughly 4% of global oil supply. Meanwhile, the only meaningful outcome from this week’s meeting between President Trump and President Xi was an extension to the U.S.–China trade truce to January 2027, pushing back a November expiry and averting a renewed escalation toward the triple-digit tariffs.
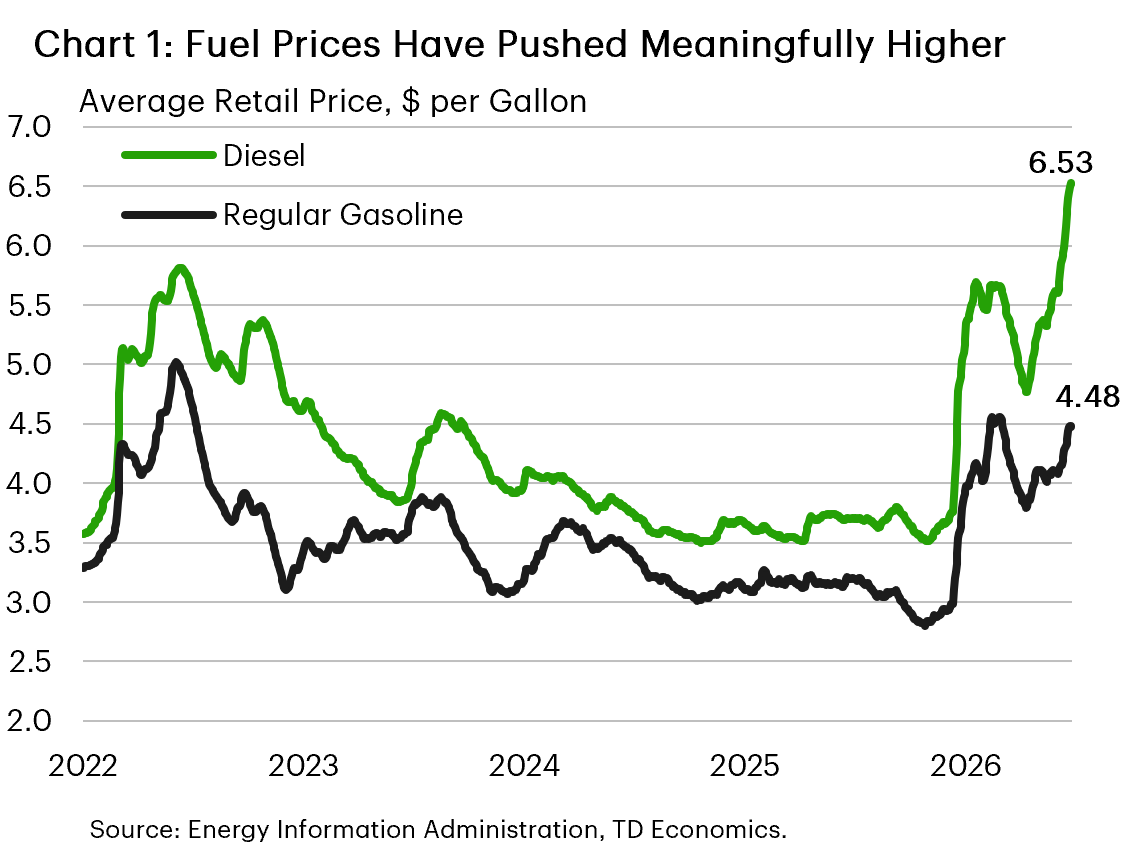
Despite the pullback in crude prices, refined-product markets remain tight. Retail diesel prices climbed above $6.50 per gallon while regular gasoline is hovering at $4.50 (Chart 1). The sharp rise in fuel costs prompted President Trump to propose a 90-day ban on diesel exports. Because the U.S. supplies roughly 20% of globally traded diesel, a ban would immediately redirect more supply to the domestic market, providing some near-term relief at the pump. However, the effects would vary considerably by region. The Gulf Coast, home to more than half of U.S. refining capacity, produces substantially more fuel than it consumes, while the East Coast relies partly on imports. An export ban would therefore strand excess supply on the Gulf Coast while tightening global markets. It could also create broader distortions because refineries jointly produce gasoline, diesel, and jet fuel. If surplus diesel forced refiners to reduce crude throughput, supplies of gasoline and jet fuel could also tighten, adding upward pressure to their prices.
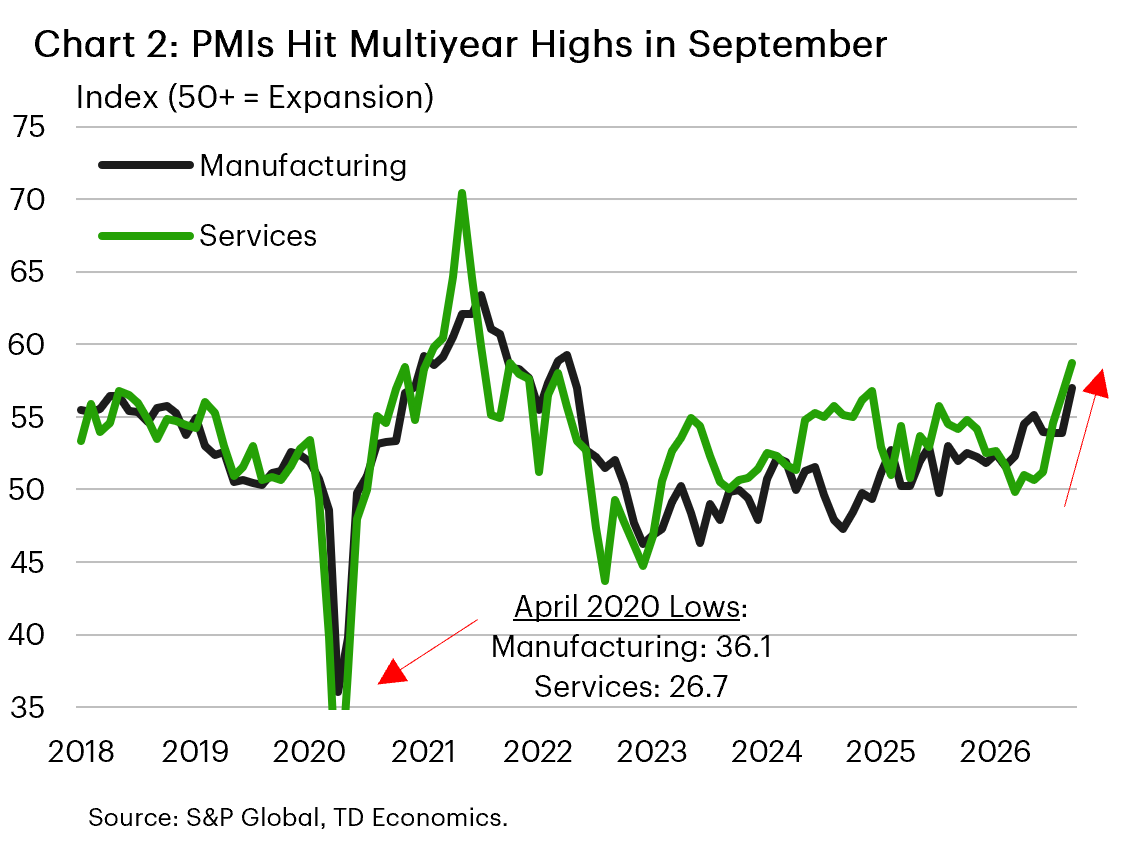
Simply put, there is no easy way to lower refined-product prices without a corresponding pullback in crude oil – and that appears unlikely in the near term. As a result, the second-round effects of higher energy costs may persist longer than previously expected. This has become a growing concern for Fed officials, particularly as strong aggregate demand also appears to be keeping inflation elevated. That concern was reinforced by S&P’s flash estimates of manufacturing and services PMIs for September, which showed activity expanding at its fastest pace in several years (Chart 2). The acceleration was driven largely by sharp gains in new orders and employment, while input costs also rose.
Fed officials had appeared increasingly divided earlier in the year, but this week’s remarks conveyed far greater unity, consistent with last week’s unanimous decision to raise rates. All nine officials who discussed the outlook struck a hawkish tone, and none expressed clear support for a pause. Next week’s August PCE inflation data and September employment report will be key in shaping the Fed’s next decision. Fed futures are currently pricing 66% odds of another hike in October.
Thomas Feltmate, Director & Senior Economist | 416-944-5730
This Financial News report is provided by TD Economics. It is for informational and educational purposes only as of the date of writing and may not be appropriate for other purposes. The views and opinions expressed may change at any time based on market or other conditions and may not come to pass. This material is not intended to be relied upon as investment advice or recommendations, does not constitute a solicitation to buy or sell securities and should not be considered specific legal, investment or tax advice. The report does not provide material information about the business and affairs of TD Bank Group and the members of TD Economics are not spokespersons for TD Bank Group with respect to its business and affairs. The information contained in this financial news report has been drawn from sources believed to be reliable but is not guaranteed to be accurate or complete. This report contains economic analysis and views, including about future economic and financial markets performance. These are based on certain assumptions and other factors and are subject to inherent risks and uncertainties. The actual outcome may be materially different. The Toronto-Dominion Bank and its affiliates and related entities that comprise the TD Bank Group are not liable for any errors or omissions in the information, analysis or views contained in this report, or for any loss or damage suffered. Do you have any questions about your finances? As financial advisors in Cornelius NC, Naples FL, and Moultonborough NH we are happy to help.
To see more news reports, click here.

Financial News for the Week of September 18th 2026
Financial News Highlights
- Persistent inflation and more momentum than expected in the economy led the Federal Reserve to raise interest rates this week.
- In our view, another rate hike appears likely, though the expected easing in inflationary pressures through H1-2027 could lead to a policy reversal in H2-2027.
- AI-related volatility and higher oil prices underscore the same tension—growth remains durable, but the forces sustaining it are also complicating the path back to 2% inflation.
U.S. - AI Highs, Oil Shocks and Higher Rates
Markets confronted a less comfortable version of the soft-landing story this week. Fresh AI headlines prompted investors to reassess when enormous capital commitments will translate into profits, while higher oil prices revived concerns about inflation and household purchasing power. Treasury yields rose as investors reconsidered the path of policy rates and the compensation required to hold longer-dated bonds. Strong investment and consumer spending are keeping financial conditions relatively loose and inflation firmer than policymakers would prefer.
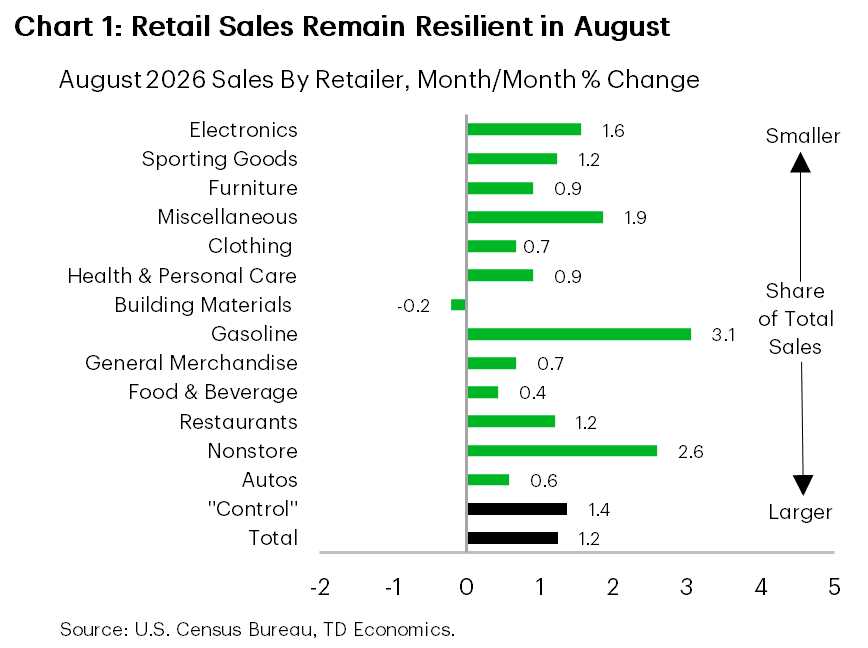
Wednesday’s retail-sales surprise reinforced that notion. August sales rose 1.2% month-on-month, well ahead of expectations, with broad-based gains beyond gasoline and autos (Chart 1). Inflation-adjusted spending also advanced solidly, lifting our tracking for third-quarter consumption and near-term GDP growth. Housing starts offered a softer counterpoint, falling 2.6% as weaker multifamily construction outweighed stronger single-family building, while lower permits pointed to further moderation. As one of the economy’s more interest-rate-sensitive sectors, housing is being hampered by higher borrowing costs. Yet with financial conditions still supporting investment and consumer demand, this weakness remains concentrated. The economy’s resilience makes a rapid return to lower rates less likely, as strong spending keeps tighter policy necessary to restrain inflation.
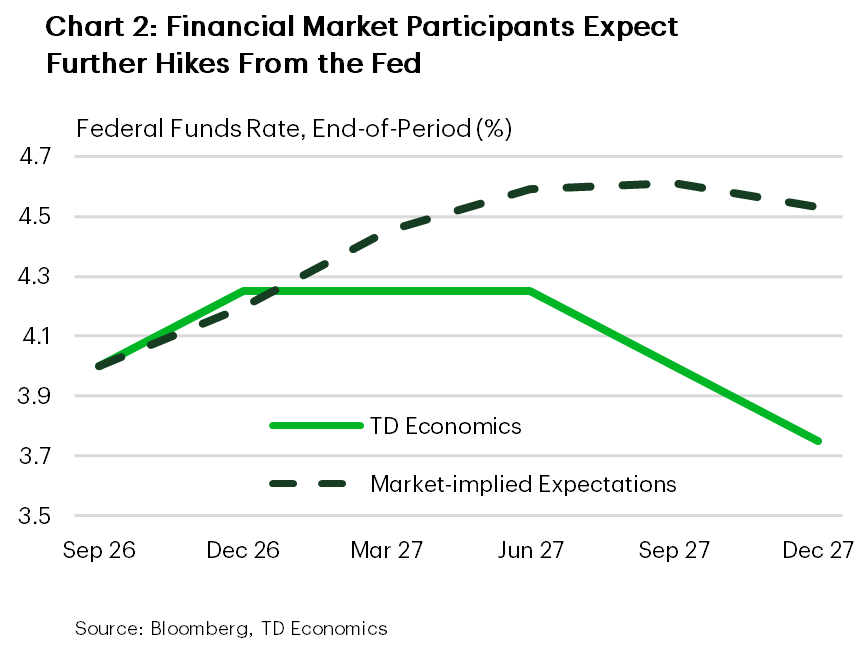
The FOMC expressed this logic in Wednesday’s decision. In addition to raising its policy rate, the Federal Reserve signaled that the current stance is not sufficiently restrictive and left the door open to further tightening. Chair Kevin Warsh was unusually clear: rates had to rise because inflation has remained too high for too long, financial conditions are not clearly restraining demand, and the persistent oil shock could spread into broader price setting. The University of Michigan consumer sentiment survey reinforced that assessment, with year-ahead inflation expectations jumping to 4.6% from 4.0% and long-run expectations edging up to 3.4%.
Our latest Quarterly Economic Forecast reaches a similar conclusion. We now expect another rate hike this year and a later start to easing—a meaningful shift from our previous view that the Fed could remain on hold as inflation subsided (Chart 2). Resilient consumer demand and AI-led investment are extending the expansion, but also slowing the final stage of disinflation.
Next week’s lighter data calendar should show whether stronger growth is broadening beyond consumers and AI investment. Business surveys, housing data, durable-goods orders and a raft of Fed speeches will provide useful signals, but the conclusion is unlikely to hinge on any single release. Resilience is both the economy’s greatest strength and its main policy complication: growth is holding up, but delaying the rate relief households and businesses had expected.
Vikram Rai, Senior Economist | 416-923-1692
This Financial News report is provided by TD Economics. It is for informational and educational purposes only as of the date of writing and may not be appropriate for other purposes. The views and opinions expressed may change at any time based on market or other conditions and may not come to pass. This material is not intended to be relied upon as investment advice or recommendations, does not constitute a solicitation to buy or sell securities and should not be considered specific legal, investment or tax advice. The report does not provide material information about the business and affairs of TD Bank Group and the members of TD Economics are not spokespersons for TD Bank Group with respect to its business and affairs. The information contained in this financial news report has been drawn from sources believed to be reliable but is not guaranteed to be accurate or complete. This report contains economic analysis and views, including about future economic and financial markets performance. These are based on certain assumptions and other factors and are subject to inherent risks and uncertainties. The actual outcome may be materially different. The Toronto-Dominion Bank and its affiliates and related entities that comprise the TD Bank Group are not liable for any errors or omissions in the information, analysis or views contained in this report, or for any loss or damage suffered. Do you have any questions about your finances? As financial advisors in Cornelius NC, Naples FL, and Moultonborough NH we are happy to help.
To see more news reports, click here.

Financial News for the Week of August 28th 2026
Financial News Highlights
- In his Jackson Hole keynote, Fed Chair Kevin Warsh delivered a hawkish assessment, prompting market odds
to shift firmly toward a near-term rate hike. - The second estimate of Q2 GDP left headline growth unchanged at 1.5% annualized, but revised growth in real
final sales to private domestic purchasers up moderately to a strong 4.2%. - July’s PCE report offered little evidence of renewed disinflation, with core inflation remaining well above the
Federal Reserve’s 2% target.
A Hawkish Assessment, Still No Forward Guidance
U.S. markets spent the week balancing resilient demand against persistent inflation and renewed trade frictions. The main event, however, was Fed Chair Warsh’s Friday keynote at Jackson Hole. While offering little meeting-specific guidance, he delivered a hawkish assessment that underlying inflation remains too high, pushing short-term Treasury yields and the trade-weighted U.S. dollar higher, while equities also posted modest gains.
Warsh outlined a principles-based approach to monetary policy and argued that forward guidance had “overstayed its welcome.” The Fed, in his view, should explain its objectives and framework without pre-committing to a rate path or encouraging investors to trade on policymakers’ signals. Structural changes, including artificial intelligence and greater competition for global savings, also require the Fed to reconsider assumptions formed during the previous low-rate era.
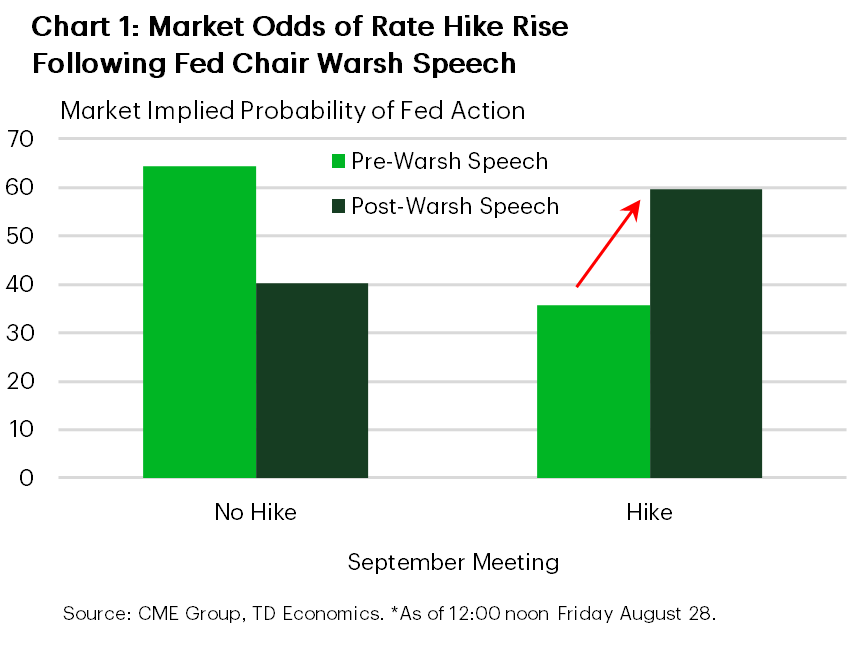
On the outlook, Warsh described the labor market as consistent with full employment but inflation as more concerning. Recent readings had not convinced him that underlying trends had improved meaningfully, and he was “hard pressed to describe broad financial conditions as restrictive.” While stopping short of explicitly endorsing a near-term hike, he warned the Fed has “work to do” if inflation does not move sufficiently toward target. He was committing to “a discipline, not to a decision.” Market pricing following the speech shifted firmly toward a near-term rate hike (Chart 1).
Other releases continued to point to a resilient economy. The second estimate of Q2 GDP left growth unchanged at 1.5% annualized, but stronger details pointed to solid underlying demand. Real final sales to private domestic purchasers were revised up moderately to 4.2%. On payrolls, a preliminary benchmark revision placed the March 2026 payroll level 79,000 below the current estimate, a modest adjustment that leaves the labour-market picture relatively intact.
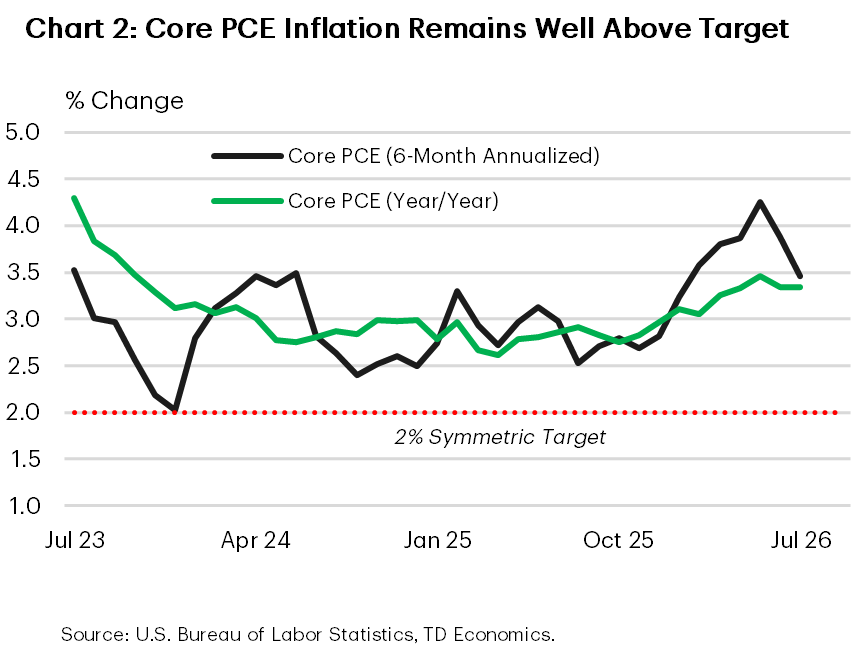
July’s income and spending report showed decent consumer momentum despite a soft month. Real spending was unchanged in July, but the three-month annualized trend is running at a healthy 3.3%, consistent with consumer spending of 2.5% in Q3. More importantly for the Fed, core PCE inflation remained well above target, offering little evidence of renewed disinflation (Chart 2).
Warsh’s task is complicated by forces outside the Fed. Treasury’s expanded purchases of longer-dated debt could lower borrowing costs working against monetary restraint. Trade tensions pose another inflation risk. The U.S. imposed 50% tariffs on $20 billion of Canadian goods, including USMCA-compliant products, while Canada announced matching countermeasures effective September 8. The direct effect should remain manageable at the current scale, but further escalation remains a risk.
The bottom line is that Warsh provided little guidance on timing but a clearer, hawkish policy bias. With growth resilient, a lot is riding on the August CPI report to show progress on underlying inflation and keep the Fed on the sidelines.
This Financial News report is provided by TD Economics. It is for informational and educational purposes only as of the date of writing and may not be appropriate for other purposes. The views and opinions expressed may change at any time based on market or other conditions and may not come to pass. This material is not intended to be relied upon as investment advice or recommendations, does not constitute a solicitation to buy or sell securities and should not be considered specific legal, investment or tax advice. The report does not provide material information about the business and affairs of TD Bank Group and the members of TD Economics are not spokespersons for TD Bank Group with respect to its business and affairs. The information contained in this financial news report has been drawn from sources believed to be reliable but is not guaranteed to be accurate or complete. This report contains economic analysis and views, including about future economic and financial markets performance. These are based on certain assumptions and other factors and are subject to inherent risks and uncertainties. The actual outcome may be materially different. The Toronto-Dominion Bank and its affiliates and related entities that comprise the TD Bank Group are not liable for any errors or omissions in the information, analysis or views contained in this report, or for any loss or damage suffered. Do you have any questions about your finances? As financial advisors in Cornelius NC, Naples FL, and Moultonborough NH we are happy to help.
To see more news reports, click here.

Financial News for the Week of August 21st 2026
Financial News Highlights
- Longer-term Treasury yields continued to climb this week, despite the Treasury Department’s announcement to increase longer-duration debt buybacks.
- Elevated interest rates continue to weigh on housing activity, with housing starts plummeting 12.4% m/m to 1.2 million units in July.
- Minutes from the July 28-29 FOMC meeting showed policymakers’ concerns about inflation have deepened, with “several” participants ready to raise interest rates.
Long Yields, Short Relief
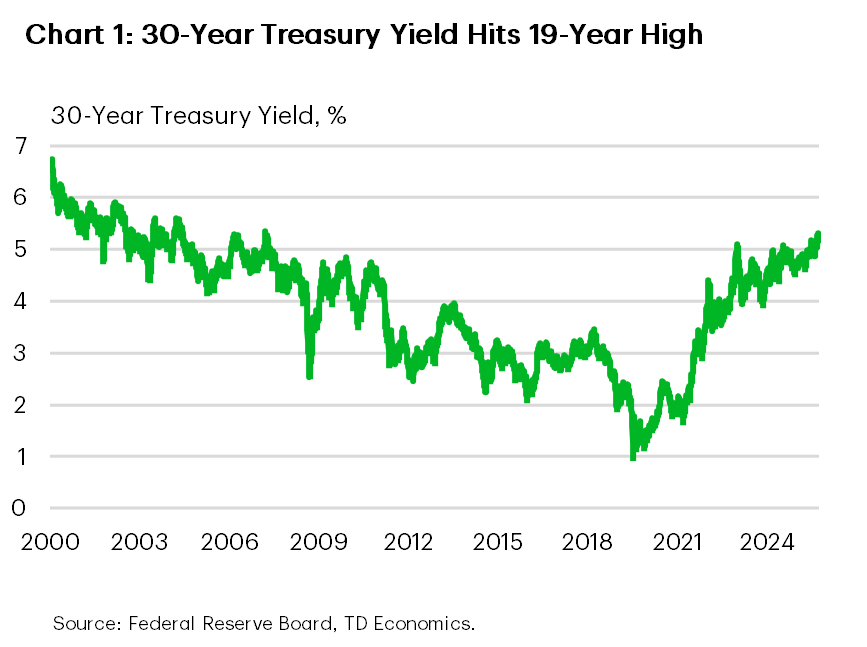
It was a quiet week on the economic data calendar, but a very active one in financial markets. Longer-term Treasury yields continued their relentless climb, with the 30-year yield briefly touching a 19-year high on Monday (Chart 1). Some relief came Wednesday, when the Treasury Department announced it would temporarily increase longer-duration debt buybacks to improve market liquidity. However, the move does nothing to change the broader fiscal backdrop, and at best only modestly alters the composition of debt holdings. With total U.S. government debt topping $40 trillion this week, bond markets quickly refocused on the troubling fiscal trajectory, leading yields to retrace most of Wednesday’s decline. Equity markets also came under pressure this week, despite multiple major retailers lifting earnings guidance. At the time of writing, the S&P500 is down 1.5%, while the NASDAQ is lower by 2.4%.
As we noted in our Quarterly Q&A, most of the recent increase in longer-term yields reflects two forces: shifting expectations for Fed policy and a higher term premium. While the precise drivers are difficult to isolate, fiscal supply concerns appear to be a major contributor to the rise in the term premium. With the U.S. expected to run annual deficits of +6% of GDP for the foreseeable future, the Treasury Department will need to issue a growing volume of securities. As issuance rises, investors are left to absorb more duration risk, which typically requires a higher term premium. Viewed through that lens, the solution will not come from adjusting the maturity mix of Treasury issuance, but rather from reducing the overall debt burden through fiscal consolidation.
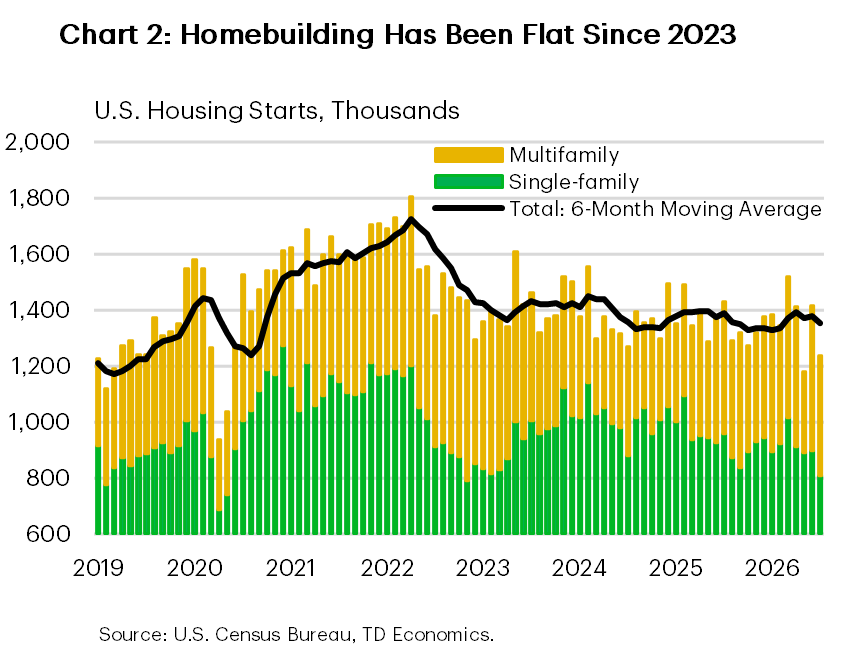
Turning to the real economy, few sectors have felt the impact of higher rates more acutely than housing. Data released this week reinforced that point, with housing starts falling 12.4% m/m to 1.2 million units—their second-lowest level outside the pandemic since March 2019. The deterioration was broad based, with declines across both single- and multifamily segments. Looking through the month-to-month volatility, homebuilding activity has effectively moved sideways since 2023 (Chart 2).
At this point, relief from lower policy rates looks unlikely. Minutes from the last FOMC meeting underscored policymakers’ growing concern over persistently elevated inflation. The minutes noted that “many participants assessed that policy tightening would likely be necessary if inflation did not decline,” while “some” viewed the recent tightening in financial conditions as insufficient to restore price stability. Admittedly, CPI data released after the July 28–29 FOMC meeting showed some further cooling in price pressures. But that may already feel somewhat backward-looking amid renewed tensions in the Middle East. WTI prices traded 5% higher this week and are now sitting at a four-week high of $86/bbl. More concerning is the growing tightness in refined product markets, particularly diesel and jet fuel. While Chair Warsh may touch on these developments in next week’s Jackson Hole speech, the focus is likely to lean more toward the “big questions” facing monetary policy than a near-term policy discussion. Without additional guidance, markets’ risk being left underwhelmed, potentially adding further upward pressure on longer-term yields.
This Financial News report is provided by TD Economics. It is for informational and educational purposes only as of the date of writing and may not be appropriate for other purposes. The views and opinions expressed may change at any time based on market or other conditions and may not come to pass. This material is not intended to be relied upon as investment advice or recommendations, does not constitute a solicitation to buy or sell securities and should not be considered specific legal, investment or tax advice. The report does not provide material information about the business and affairs of TD Bank Group and the members of TD Economics are not spokespersons for TD Bank Group with respect to its business and affairs. The information contained in this financial news report has been drawn from sources believed to be reliable but is not guaranteed to be accurate or complete. This report contains economic analysis and views, including about future economic and financial markets performance. These are based on certain assumptions and other factors and are subject to inherent risks and uncertainties. The actual outcome may be materially different. The Toronto-Dominion Bank and its affiliates and related entities that comprise the TD Bank Group are not liable for any errors or omissions in the information, analysis or views contained in this report, or for any loss or damage suffered. Do you have any questions about your finances? As financial advisors in Cornelius NC, Naples FL, and Moultonborough NH we are happy to help.
To see more news reports, click here.

Financial News for the Week of August 7th 2026
Financial News Highlights
- Stocks reached fresh all-time highs to start August as oil prices retreated on the back of reports of a potential deal to restart transit through the Strait of Hormuz.
- ISM surveys indicated that manufacturing and services activity continued to expand in July, but elevated input costs point to lingering inflation pressures.
- The labor market lost 23k jobs in July, but this was driven by an outsized decline in local government educational services, likely related to residual seasonality.
Stocks Hit All-Time Highs Amid Mixed Economic Data
The first week of August kicked off with stocks hitting fresh all-time highs as oil prices retreated on news of a potential near-term deal to restart transit through the Strait of Hormuz. The deal is reportedly being negotiated between Oman and Iran, but a formal agreement between all parties has yet to be announced as of the time of writing. The S&P 500 rose 3.5% on the week as oil prices fell by 10% and the U.S. 10-year Treasury yield ended the week roughly 10 basis points lower.
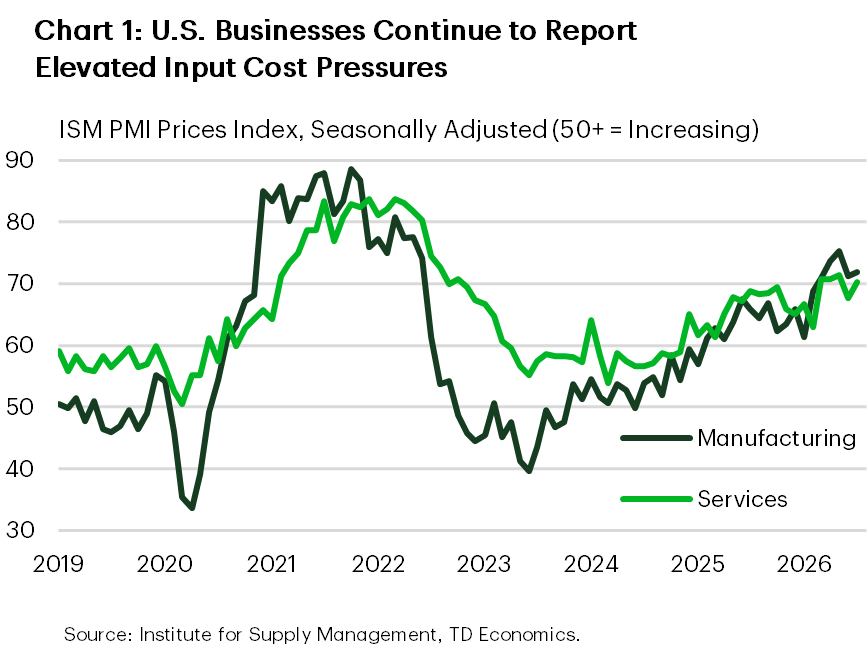
Higher oil prices have contributed to stronger nominal manufacturing activity in 2026, while also helping to push the ISM Manufacturing PMI to a four-year high in July. However, there are reasons to view the survey’s strength with some caution. The ISM Prices Paid Index remains near a four-year high (Chart 1), indicating elevated input cost pressures across the manufacturing sector. At the same time, a portion of the improvement in the headline PMI reflects slower supplier deliveries, which the survey interprets as a sign of stronger demand, but can also be consistent with supply-chain constraints. Taken together, the survey continues to point to an expansion in manufacturing activity, though likely at a more moderate pace than implied by the headline reading.
The larger services sector also continued to expand in July according to the ISM report, with new orders and business activity both picking up. However, the report was more concerning for the Federal Reserve, as the employment index slipped back into contraction territory and the prices paid index remained elevated.
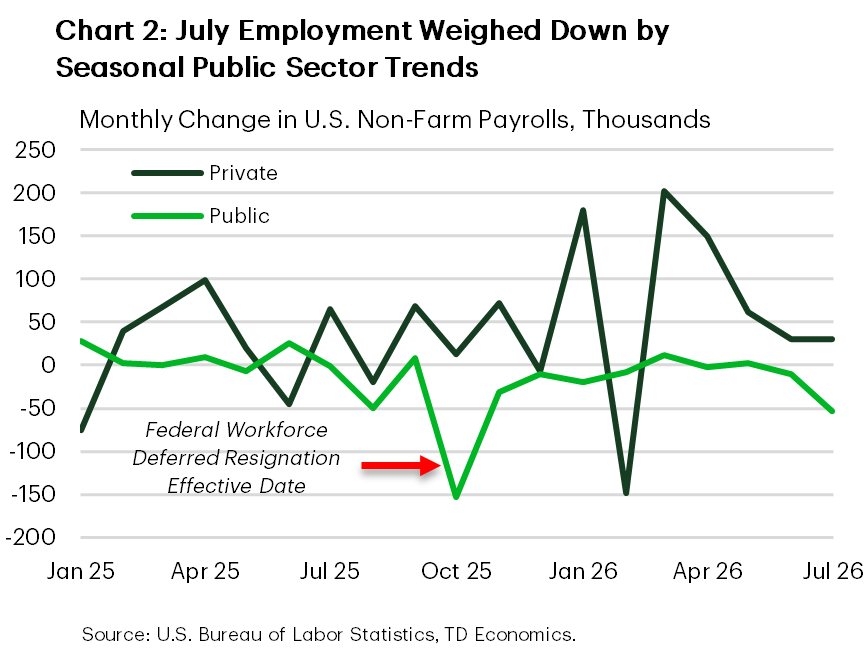
This concern was somewhat enhanced by the headline report for July employment, which showed a loss of 23k jobs. However, looking into the details, the decline was entirely driven by an outsized loss in local government educational services. This is likely driven by unaccounted for seasonality coinciding with the summer break for schools. The private sector added 30k jobs during the month, on par with the prior month trend (Chart 2). In addition, the unemployment rate ticked lower to 4.1%, consistent with a labor market that is steady overall.
Taken together, the Federal Reserve is faced with an economy that has a stable labor market, but persistent excess inflationary pressures. Among the three voting members of the FOMC that we heard from this week, Minneapolis Fed President Kashkari was the most vocal in support of policy tightening, noting he dissented in favor of a rate hike at the July meeting. Philadelphia Fed President Paulson and Governor Lisa Cook were more measured but noted that persistent inflation could require higher rates. After the employment report, odds of rate hike in September fell from roughly 50/50 to 60% odds for no hike.
With elevated uncertainty over what policy decision will be made by the Federal Reserve at their next meeting, next week’s CPI print for July is likely to be closely monitored. Consensus expectations are for an acceleration in total inflation to 3.5% year-on-year, consistent with the uptick in energy prices during the month. Currently we don’t expect a rate hike in September, but if current inflation trends prove persistent, then policy action may be required.
This Financial News report is provided by TD Economics. It is for informational and educational purposes only as of the date of writing and may not be appropriate for other purposes. The views and opinions expressed may change at any time based on market or other conditions and may not come to pass. This material is not intended to be relied upon as investment advice or recommendations, does not constitute a solicitation to buy or sell securities and should not be considered specific legal, investment or tax advice. The report does not provide material information about the business and affairs of TD Bank Group and the members of TD Economics are not spokespersons for TD Bank Group with respect to its business and affairs. The information contained in this financial news report has been drawn from sources believed to be reliable but is not guaranteed to be accurate or complete. This report contains economic analysis and views, including about future economic and financial markets performance. These are based on certain assumptions and other factors and are subject to inherent risks and uncertainties. The actual outcome may be materially different. The Toronto-Dominion Bank and its affiliates and related entities that comprise the TD Bank Group are not liable for any errors or omissions in the information, analysis or views contained in this report, or for any loss or damage suffered. Do you have any questions about your finances? As financial advisors in Cornelius NC, Naples FL, and Moultonborough NH we are happy to help.
To see more news reports, click here.

Financial News for the Week of July 31st, 2026
Financial News Highlights
- Financial markets were volatile as technology stocks came under pressure amid renewed scrutiny of AI spending, while elevated oil prices added to inflation concerns.
- The Fed held rates unchanged for a fifth consecutive meeting. Growing markets’ concerns about the Fed’s ability to lower inflation pushed 30-year Treasury yields to a 19-year high.
- Second-quarter GDP growth moderated, but a softer headline print masked stronger domestic demand as consumer spending rebounded and business investment remained strong.
Markets Issue a Yellow Card to the Fed
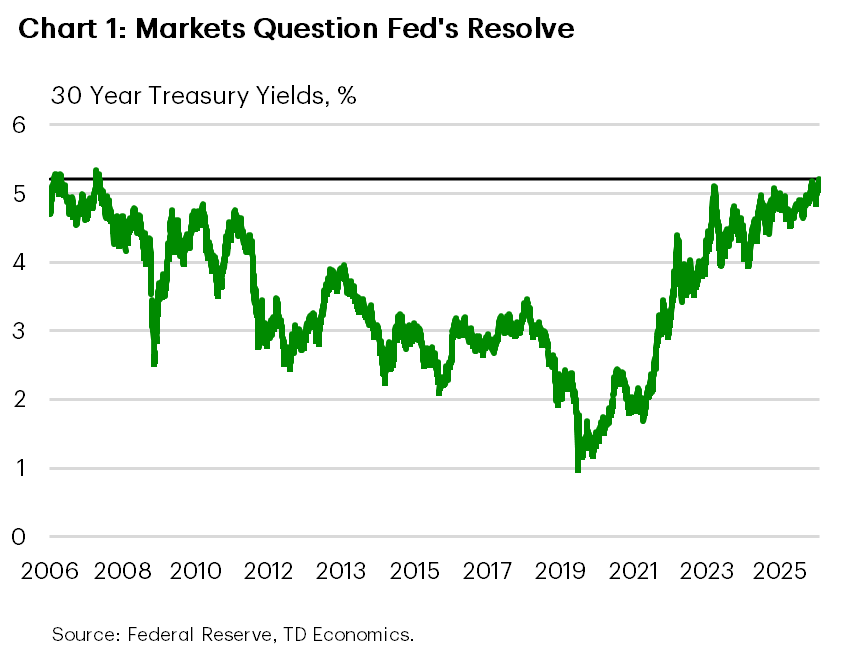
Financial markets had plenty to digest this week, with mega-cap tech earnings, the FOMC decision, and the second-quarter GDP. Equities swung sharply as investors weighed technology earnings against renewed scrutiny over AI-related capital spending and China’s progress in AI capabilities and semiconductor manufacturing. Still, stronger-than-expected results from several technology heavyweights helped revive the sentiment toward the end of the week. Oil prices also were in focus, with WTI crude easing relative to last week’s highs, but remained elevated at around US$85 per barrel Friday morning. Against that backdrop, investors have turned their attention to the Fed, where growing concern about inflation and rising doubts over the Committee’s willingness to do what is necessary to restore price stability pushed longer-term Treasury yields sharply higher.
The FOMC meeting was the week’s marquee event, though the main surprise was in the vote and not the policy announcement. Three officials dissented in favor of a 25-basis-point hike, highlighting growing concern within the Committee about inflation risks. The data support that concern. While inflation eased modestly in June, the improvement is unlikely to last if energy prices remain elevated. Core PCE inflation has remained above the Fed’s 2% target for more than five years, and the Fed is still searching for the back of the net. So even as Chair Warsh reiterated that the Committee would not “waver” in its commitment to restoring price stability, financial markets grew uneasy about the Fed’s willingness to raise rates to bring inflation back to target. 30-Year Treasury yields rose sharply following the meeting and remain near a 19-year high (Chart 1).
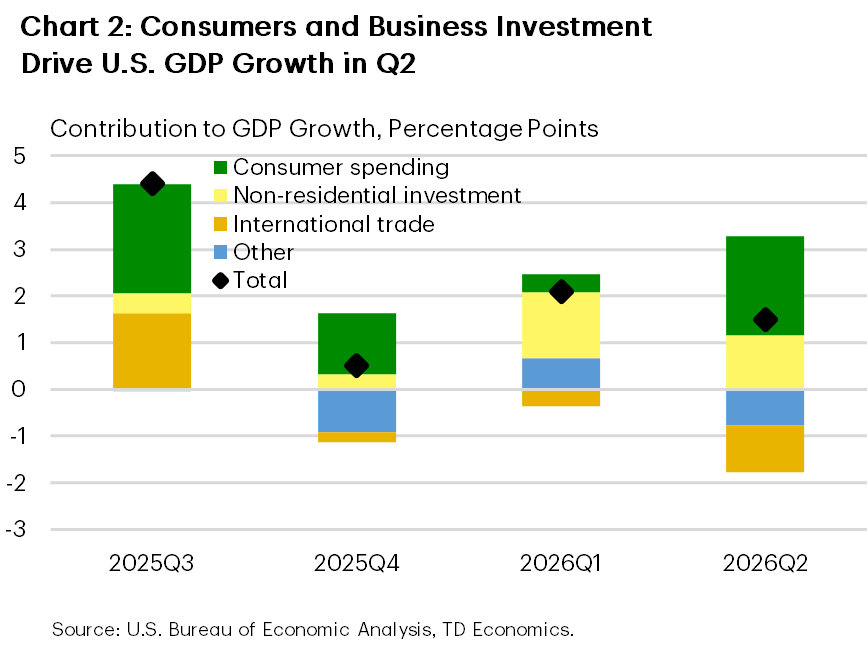
Despite the market jitters, the incoming data still point to an economy with solid underlying momentum. Real GDP growth slowed to a 1.5% annualized pace in the second quarter from 2.1% previously, but the softer headline largely reflected a surge in imports, with net trade subtracting roughly one percentage point from growth.
Under the hood, the economy’s engine was running considerably hotter than the headline GDP figure suggested, supported by a rebound in consumer spending and robust business investment (Chart 2). Consumer spending rebounded by a solid 3.2% annualized after a weather-affected first quarter. However, spending continued to outpace income, pushing the personal saving rate to its lowest level since mid-2022. With the boost from larger tax refunds fading, consumer resilience will increasingly depend on labor market strength and rising household wealth. Business investment also remained a bright spot. AI-related investment remained robust, but it was no longer the only game in town. Spending on industrial equipment surged 29% annualized in the second quarter, adding to evidence that the current capital spending cycle is becoming more broad-based.
Next week’s ISM surveys and the July employment report will shed further light on the balance of risks to prices and employment. For now, resilient domestic demand and persistent inflation pressures suggest the Fed’s inflation fight is entering overtime, with markets seeking reassurance that policymakers can credibly bring inflation back to target.
This Financial News report is provided by TD Economics. It is for informational and educational purposes only as of the date of writing and may not be appropriate for other purposes. The views and opinions expressed may change at any time based on market or other conditions and may not come to pass. This material is not intended to be relied upon as investment advice or recommendations, does not constitute a solicitation to buy or sell securities and should not be considered specific legal, investment or tax advice. The report does not provide material information about the business and affairs of TD Bank Group and the members of TD Economics are not spokespersons for TD Bank Group with respect to its business and affairs. The information contained in this financial news report has been drawn from sources believed to be reliable but is not guaranteed to be accurate or complete. This report contains economic analysis and views, including about future economic and financial markets performance. These are based on certain assumptions and other factors and are subject to inherent risks and uncertainties. The actual outcome may be materially different. The Toronto-Dominion Bank and its affiliates and related entities that comprise the TD Bank Group are not liable for any errors or omissions in the information, analysis or views contained in this report, or for any loss or damage suffered. Do you have any questions about your finances? As financial advisors in Cornelius NC, Naples FL, and Moultonborough NH we are happy to help.
To see more news reports, click here.

Financial News for the Week of June 17th, 2026
Financial News Highlights
- Tensions in the Middle East continued to escalate this week, pushing WTI prices back above $80 per-barrel.
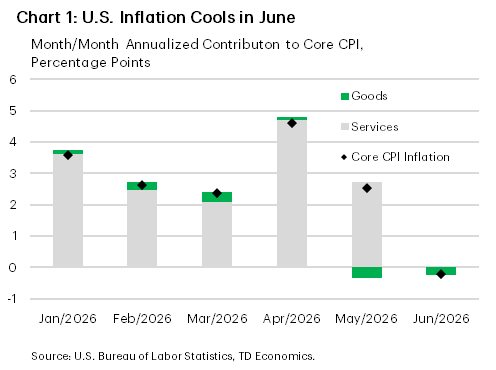
- Inflation pressures cooled more than expected in June. Though the recent U-turn in oil prices raises concerns over the durability of the disinflationary dynamics.
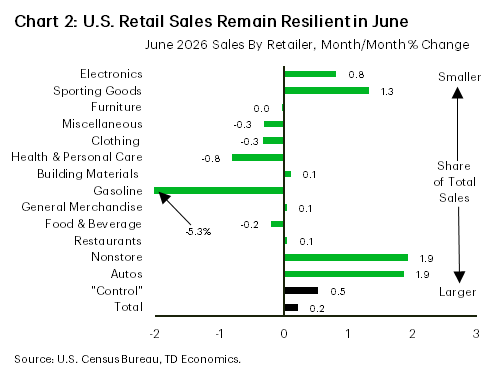
- Retail sales remained decently strong in June, suggesting consumer spending regained some momentum in Q2 after stalling in Q1.
Cooler Inflation Quiets Calls for a July Hike
Despite a relatively busy week on the economic data calendar, market attention remained focused on renewed tensions in the Middle East. Earlier in the week, Iranian forces attacked multiple oil vessels transiting the Strait of Hormuz, prompting the U.S. to resume strikes on various military targets across Iran and reimpose its naval blockade. Tanker traffic through the vital passageway has again come to a halt, pushing WTI prices back above $80 per barrel.
The renewed upward pressure on oil prices helped to temper the market response to an otherwise very encouraging inflation report. Headline CPI declined by 0.4% m/m in June – it’s first pullback since June 2024 and largest since April 2020 – pushing the 12-month change down to 3.5% (see commentary). A sharp drop in gasoline prices was largely responsible for last month’s decline, though even after removing these effects there were plenty of positive developments. Core inflation was flat for the month, as both goods and services were little changed (Chart 1). Importantly, many of the categories where tariffs had been adding to price pressures over the past year, including appliances, medical goods and apparel were all lower on the month – suggesting the worst of the tariff passthrough is now in the rearview mirror. Also encouraging was the fact that there was little evidence of higher energy prices bleeding into core inflation.
The disinflationary dynamics were further reinforced by a soft producer price index reading, which helped to remove speculation of a Fed rate hike later this month. That said, Fed futures are still priced for a little more than one rate hike by year-end, as the U-turn in oil prices is already raising concerns on the durability of the disinflationary dynamics.
Retail sales for the month of June provided further confirmation that households continue to shrug off the effects of higher energy prices (Chart 2). While the headline figure posted only a modest gain, that was partly related to a sharp drop in nominal sales at gasoline stations –owing to price effects (see commentary). Focusing on the control group, which removes volatile categories, it showed a much healthier gain in spending while revisions to the prior month were a bit higher. This reinforces the view that consumer spending regained some momentum in Q2, after sputtering in Q1. However, the spend dynamics remain K-shaped, with lower-and-middle income consumers increasingly price sensitive and hesitant to spend on discretionary items – something that was highlighted in this week’s Fed Beige Book.
Anyone hoping that Fed Chair Warsh would relent and provide some forward guidance during his first Congressional testimony this week was sorrily disappointed. Instead, Warsh restated the Committee’s unwavering commitment to return price stability, but provided no hints on the Fed’s next move. Several other policymakers spoke this week and perhaps the biggest takeaway is that while all were encouraged by last month’s softer inflation figures, one data point does not make a trend. Several more months of easing inflation will be required to convince officials that price pressures are moving in the right direction. If this were to occur, expectations for rate hikes should fade, leading to some downward pressure on yields.
This Financial News report is provided by TD Economics. It is for informational and educational purposes only as of the date of writing and may not be appropriate for other purposes. The views and opinions expressed may change at any time based on market or other conditions and may not come to pass. This material is not intended to be relied upon as investment advice or recommendations, does not constitute a solicitation to buy or sell securities and should not be considered specific legal, investment or tax advice. The report does not provide material information about the business and affairs of TD Bank Group and the members of TD Economics are not spokespersons for TD Bank Group with respect to its business and affairs. The information contained in this financial news report has been drawn from sources believed to be reliable but is not guaranteed to be accurate or complete. This report contains economic analysis and views, including about future economic and financial markets performance. These are based on certain assumptions and other factors and are subject to inherent risks and uncertainties. The actual outcome may be materially different. The Toronto-Dominion Bank and its affiliates and related entities that comprise the TD Bank Group are not liable for any errors or omissions in the information, analysis or views contained in this report, or for any loss or damage suffered. Do you have any questions about your finances? As financial advisors in Cornelius NC, Naples FL, and Moultonborough NH we are happy to help.
To see more news reports, click here.