
Financial News for the Week of April 1st, 2022
FINANCIAL NEWS HIGHLIGHTS OF THE WEEK
- Another solid jobs report showed that the U.S. economy added 431k jobs in March. Wage growth picked up and the unemployment rate fell 0.2 percentage points to 3.6%.
- President Biden presented a $5.8 trillion budget to Congress with a hefty focus on defense spending. Separately, the President also announced releases from the strategic petroleum reserve to combat rising energy prices.
- Nominal consumer spending and income rose in February. Real income, however, pulled back as prices rose rapidly. Inflation, as measured by the year-on-year percent change in the personal consumption price index accelerated to 6.4%.
U.S. -Economic Recovery Battles Inflation Headwinds
On the agenda this week in financial news were several important data releases including consumer income and spending, manufacturing activity, and the March employment report. President Biden also released his budget proposal and announced a plan to release supply from the strategic petroleum reserve in order to combat rising prices.
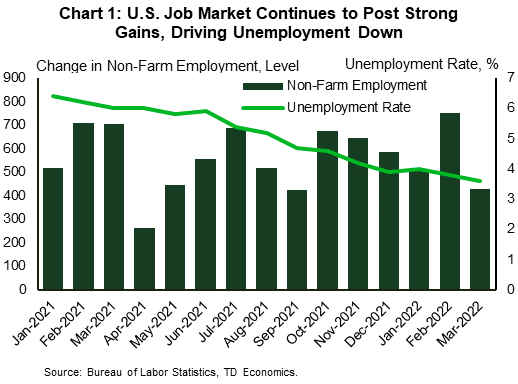
Jumping right in, nonfarm payrolls expanded by 431k in March with most sectors posting job gains. The only exceptions were transportation & warehousing and utilities. The unemployment rate edged down to 3.6% from 3.8% in February as household employment growth exceeded growth in the labor force (Chart 1). Wages continued to post solid year-on-year growth, ticking up from 5.1% in February to 5.6%. Overall, the report indicates a job market driving full steam ahead, and barring further disruptions, could be back to its pre-pandemic level of employment by the middle of the year.
The ISM Manufacturing Index indicated that factory activity, while still expanding, slowed in March. The index pulled back to 57.1 from 58.6 the month before. There were notable declines in new orders and an increase in prices paid. On the upside, the backlog of orders declined, while the employment index rose.

Turning to the household sector, nominal personal income and spending rose 0.5% and 0.2% respectively in February. An even stronger gain in prices however took a bite out of real disposable income, which declined for the third consecutive month, largely reflecting waning transfers to households. Inflation, meanwhile, continued to accelerate. The personal consumption expenditure (PCE) index rose 6.4% year-over-year (y/y) versus 6.1% in January (Chart 2). The core PCE index also accelerated to 5.4% y/y in February, up from 5.2%. From the Fed’s perspective, inflation is uncomfortably high as supply chains remain stressed, Covid shutdowns in China hamper trade and the Russian-Ukraine war sparks further volatility.
In response to rising energy prices, President Biden plans to release up to 180 million barrels of oil from the strategic reserve over the next six months. While the release may help to alleviate near-term market tightness, the reserve is currently at a 20-year low. Further releases would drive the stockpile even lower, ratcheting up risks surrounding global spare capacity over the longer term.
Finally, President Biden presented his budget proposal for the 2023 fiscal year. The $5.8 trillion budget would raise taxes on billionaires and corporations. A new tax proposal would require households worth more than $100 million to pay a rate of at least 20% on their income as well as a tax on unrealized capital gains on assets such as stocks, bonds, or privately held companies. On the spending side, the budget would increase spending on the military, law enforcement, affordable housing and supply chains, while attempting to reduce the federal deficit by $1 trillion over a decade.
Shernette Mcleod, Economist | 416-415-0413
This Financial News report is provided by TD Economics. It is for informational and educational purposes only as of the date of writing and may not be appropriate for other purposes. The views and opinions expressed may change at any time based on market or other conditions and may not come to pass. This material is not intended to be relied upon as investment advice or recommendations, does not constitute a solicitation to buy or sell securities and should not be considered specific legal, investment or tax advice. The report does not provide material information about the business and affairs of TD Bank Group and the members of TD Economics are not spokespersons for TD Bank Group with respect to its business and affairs. The information contained in this report has been drawn from sources believed to be reliable but is not guaranteed to be accurate or complete. This report contains economic analysis and views, including about future economic and financial markets performance. These are based on certain assumptions and other factors and are subject to inherent risks and uncertainties. The actual outcome may be materially different. The Toronto-Dominion Bank and its affiliates and related entities that comprise the TD Bank Group are not liable for any errors or omissions in the information, analysis or views contained in this report, or for any loss or damage suffered.
Financial News for the Week of March 25th, 2022
FINANCIAL NEWS HIGHLIGHTS OF THE WEEK
- In a carefully crafted speech this week in D.C., Fed Chair Powell reaffirmed the Fed’s keenness for a more aggressive removal of monetary stimulus in order to restore price stability.
- Powell highlighted the potential for the Fed to go with hikes larger than 25 basis points (bps) if deemed appropriate. Market odds now heavily favor 50 bps hikes at the next two FOMC meetings in May and June.
- On the data front, both new single-family home sales and pending (existing) home sales pulled back in February.
U.S. -Fed’s Focus Tilts Squarely on Restoring Price Stability
If last week’s Fed rate hike (and a sharp move up in the number of future expected hikes among FOMC members) left any doubt about the Fed’s transition to a more hawkish stance, Powell’s remarks this week are likely to have sealed the deal in financial news. There was no shortage of Fed speeches to parse, in a week that didn’t have much in the way of data.
The most noteworthy speech was Fed Chair Powell’s remarks in D.C. on Monday. Reading carefully crafted remarks, Powell recognized that the labor market is strong and still has “substantial momentum”. Further driving home his point, last week’s jobless claims fell to the lowest level since 1969. Powell also noted that inflation is “much too high” and touched on the fallout from the Russia-Ukraine conflict, which will put additional upward price pressure through several key commodities, including crude oil. The price of the latter is up from last week and is holding near $110 per barrel at time of writing – a level that is broadly in line with our recent forecast (see here). Powell also emphasized that the path of inflation remains uncertain. He pointed out the potential for more COVID-related supply chain disruptions out of China, where a rise in Covid infections led to the lockdown of another major city of nine million people this week.
On the monetary policy response, Chair Powell noted that the Fed would not assume significant near-term supply-side relief on inflation but would instead be looking for actual progress on the ground. This was followed by more hawkish comments regarding the size of rate hikes, with the Chair highlighting the potential for the Fed to go with hikes larger than 25 basis points (bps) if deemed appropriate. Powell went further, stating that if the Fed determines the need to “tighten beyond common measures of neutral and into a more restrictive stance”, it will do that as well. This was already shown in the Fed’s updated dot plot, which had a median projected policy rate of 2.8% in 2023-24, above the long-run rate of 2.4%.
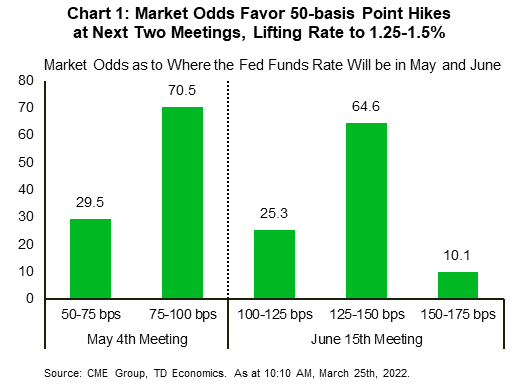
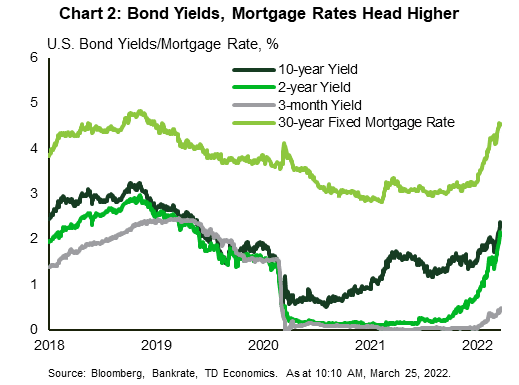
Several other Fed officials, including Mester, Daly, and Evans, echoed the hawkish stance by showing more comfort with rate hikes larger than a quarter point. It comes as no surprise then that market odds are now heavily favoring 50 bps hikes at the next two policy meetings (Chart 1). Bond yields and mortgage rates, meanwhile, continued to head higher (Chart 2). Thirty-year mortgage rates rose above 4.5% this week – a sharp increase from a little over 3% at the start of the year. Higher interest rates will take some steam out of housing demand this year, with this week’s declines in new and pending home sales for the month of February not entirely surprising in financial news. Higher borrowing costs are part of the reason why we expect the housing market to cool this year. For more on our housing outlook see here.
The bottom line is that the Fed is behind the curve on inflation, and now needs to take stronger steps to rein it in. While this also increases the chances of policy error, the Fed has reaffirmed its keenness for a more aggressive removal of monetary stimulus to restore price stability.
Admir Kolaj, Economist | 416-944-6318
This Financial News report is provided by TD Economics. It is for informational and educational purposes only as of the date of writing and may not be appropriate for other purposes. The views and opinions expressed may change at any time based on market or other conditions and may not come to pass. This material is not intended to be relied upon as investment advice or recommendations, does not constitute a solicitation to buy or sell securities and should not be considered specific legal, investment or tax advice. The report does not provide material information about the business and affairs of TD Bank Group and the members of TD Economics are not spokespersons for TD Bank Group with respect to its business and affairs. The information contained in this report has been drawn from sources believed to be reliable but is not guaranteed to be accurate or complete. This report contains economic analysis and views, including about future economic and financial markets performance. These are based on certain assumptions and other factors and are subject to inherent risks and uncertainties. The actual outcome may be materially different. The Toronto-Dominion Bank and its affiliates and related entities that comprise the TD Bank Group are not liable for any errors or omissions in the information, analysis or views contained in this report, or for any loss or damage suffered.

Financial News for the Week of March 18th, 2022
FINANCIAL NEWS HIGHLIGHTS OF THE WEEK
- The U.S. Federal Reserve raised interest rates for the first time since 2018, and signaled it is prepared to raise rates substantially in order to contain inflation.
- Oil prices were down this week as renewed lockdowns in China raised worries about demand. Uncertainty on the outlook is very high given Russia’s war in Ukraine, and we have marked down our own economic forecast released this week.
- U.S. economic data continued to show resilience through February, with another jump higher in housing starts. Retail sales also showed people spending more on dining out, boding well for the expected pick up in services spending.
U.S. -The Fed Amps Up Its Fight Against Inflation
There was a lot going on for markets this week in financial news: The Fed’s first interest rate hike since 2018, a busy economic data calendar, and the ongoing war in Ukraine. The most notable financial market move was the tumble in commodity prices, which has buoyed sentiment on equity markets worried about the impact on the global economy from sky-high energy costs. However, part of the reason for lower oil prices is not so positive. China has brought in new Covid lockdowns to restrain growth in cases, which is expected to dampen demand for energy.

As was widely expected, the Fed raised its policy rate 25 basis points to a range of 0.25-0.50%. What surprised markets was the sharp move up in the number of hikes Fed members expect. The median expectation of Fed members is for the midpoint of the range of the funds rate to be 2.8% at the end of next year, up from 1.6% in December, and above its long-run expectation of 2.4%. The Fed is behind the curve on containing inflation, and it needed to demonstrate that it is prepared to act quite aggressively to contain it and preserve its credibility.
Whether we actually see that many rate hikes is another matter. The Fed’s rate hike projections are not always born out. In September 2018, when it was in the middle of raising rates, it projected the funds rate would reach 3.1% by the end of 2019, above its estimate of the long-run rate of 3%. Instead, the Fed only raised rates to 2.5% before having to cut rates back to 1.75% as inflation was weaker than expected and the yield curve inverted – a classic signal that markets were starting to price in a recession.

Our latest forecast also downgraded economic growth in financial news, upgraded inflation, and raised the number of rate hikes expected. However, we expect fewer hikes than the Fed (Chart 1). Our forecast for economic growth is a bit softer than the Fed, and is consistent with our view that fewer rate hikes are required.
Rate hikes take time to slow economic growth, but borrowing rates like mortgages, have already moved up. The average 30-year mortgage rate moved above 4% for the first time since 2019. Even so, home builders ramped up the pace of housing starts in February to 1.769 million units, coming in ahead of market expectations, and the highest monthly reading of the pandemic (see report). However, building permits were down for both single and multi-unit projects, pointing to some giveback in March. The U.S. housing market could certainly use some new supply with the existing home market drum tight, as we discussed in our recent report.
February retail sales were another sign of strength in the U.S. economy (see report). January sales were revised upwards substantially, suggesting consumer spending is looking a bit stronger in Q1. There were also signs that consumers are shaking off their caution and heading back out to restaurants and bars, as fears of the Omicron variant subsided. Sales at food services and drinking places jumped up a healthy 2.5% in February (Chart 2) after falling through December and January. Overall, between higher rates, higher energy prices and, dwindling fiscal support, we expect the pace of growth in U.S. economy to slow through 2022. However, we expect low unemployment and pent-up demand to support a solid 2.3% pace through the year.
Leslie Preston, Senior Economist | 416-983-7053
This Financial News report is provided by TD Economics. It is for informational and educational purposes only as of the date of writing and may not be appropriate for other purposes. The views and opinions expressed may change at any time based on market or other conditions and may not come to pass. This material is not intended to be relied upon as investment advice or recommendations, does not constitute a solicitation to buy or sell securities and should not be considered specific legal, investment or tax advice. The report does not provide material information about the business and affairs of TD Bank Group and the members of TD Economics are not spokespersons for TD Bank Group with respect to its business and affairs. The information contained in this report has been drawn from sources believed to be reliable but is not guaranteed to be accurate or complete. This report contains economic analysis and views, including about future economic and financial markets performance. These are based on certain assumptions and other factors and are subject to inherent risks and uncertainties. The actual outcome may be materially different. The Toronto-Dominion Bank and its affiliates and related entities that comprise the TD Bank Group are not liable for any errors or omissions in the information, analysis or views contained in this report, or for any loss or damage suffered.

Financial News for the Week of March 11th, 2022
FINANCIAL NEWS HIGHLIGHTS OF THE WEEK
- It was another volatile week across global financial markets as the recent surge in commodity prices stoked fears of an inflationary spiral. Sentiment improved through the latter half of the week, allowing global equities to pare losses.
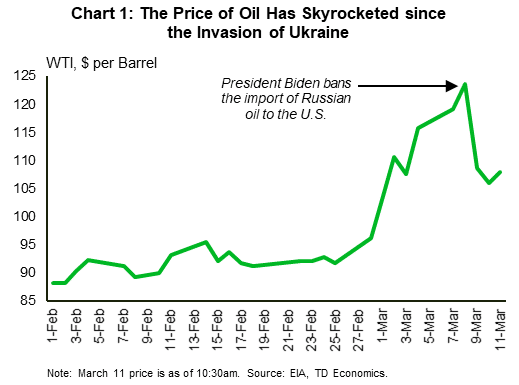
- Oil remained a focal point, with WTI briefly touching $128 per-barrel on Tuesday following President Biden’s announcement to ban the import of Russian oil. Gains were later reversed on the hopes of increased OPEC production.
- February CPI data showed a further acceleration in consumer prices, with both headline (+7.9% y/y/) and core (+6.4% y/y) inflation rising to new 40-year highs. With price pressures likely to continue to mount over the coming months, the FOMC is certain to raise rates next week.
U.S. -Looking Through the Turmoil, Ready for Lift-off
Despite Fed officials entering a ‘quiet week’ ahead of next Thursday’s FOMC meeting, it was anything but across global financial markets in financial news. New economic sanctions and fears of a prolonged Ukraine-Russia conflict have pushed commodity prices significantly higher in recent weeks, stoking fears of an inflationary spiral that could trigger a recession across Europe. The risk-off sentiment abated through the latter half of this week, allowing global equites to pare losses. At the time of writing, the S&P 500 was still lower by about 1.5%. Yields rose through much of the week, as intensifying price pressures pushed the US 10-year higher by 25 basis points to just over 2%.
Across the commodity space, oil remained a focal point. On Tuesday, both WTI and Brent briefly touched levels not seen since 2008, hitting $128 and $133 per-barrel, respectively. The sharp gains followed President Biden’s announcement that the U.S. will immediately ban imports of Russian oil. The UK made a similar commitment, agreeing to phase-out imports of Russian oil by year-end. Gains, however, were reversed from their intraweek highs on hopes that OPEC members would boost production to help make up for some of the shortfall. At the time of writing, WTI is currently down 7% on the week, trading at $108 per-barrel (Chart 1).
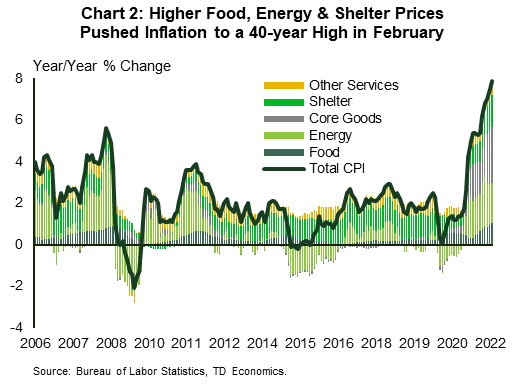
Inflation also remained a key theme for the week, as Thursday’s release of February CPI data showed a further acceleration in consumer prices. Headline CPI rose 0.8% month-on-month (m/m), which drove the year-on-year measure to 7.9% (Chart 2). Core inflation was up a softer 0.5% m/m – a slight deceleration from January – though still enough to push the annual reading to a new 40-year high of 6.4%. Higher fuel prices (6.4% m/m), food (1.0% m/m) and shelter costs (0.5% m/m) were the biggest contributors to February’s price gain. Also noteworthy was the modest cooling in used vehicle prices (-0.2% m/m), which came after four consecutive months of strong gains. New vehicle prices were still higher in February, though even here we have seen a meaningful deceleration in price growth in recent months, suggesting consumer’s may be nearing a ceiling of what they’re willing to spend for a new vehicle.
Unfortunately, inflationary pressures are likely to continue to move higher over the coming months, as the recent surge in commodity prices will continue to filter through to higher prices both at the pump and grocery stores. Even if gasoline prices hung at today’s level of $4.32 per-gallon for the rest of the month, that alone would lift headline CPI for March by an additional 0.9 percentage points.
The pinch on consumer’s wallets could lead to slightly weaker discretionary spending over the near-term, but this is unlikely to dissuade Fed officials from raising rates at next week’s meeting in further financial news. Inflationary pressures are running too hot, and the labor market has become as tight as it has ever been. Failing to move on rates runs the risk of the Fed falling even further behind the curve, which would erode its credibility and jeopardize the economic recovery. Expect the FOMC to acknowledge the recent tightening in financial market conditions, but maintain its hawkish tone, setting the stage for what will be a series of rate hikes over the remainder of the year.
Thomas Feltmate, Senior Economist | 416-944-5730
This Financial News report is provided by TD Economics. It is for informational and educational purposes only as of the date of writing and may not be appropriate for other purposes. The views and opinions expressed may change at any time based on market or other conditions and may not come to pass. This material is not intended to be relied upon as investment advice or recommendations, does not constitute a solicitation to buy or sell securities and should not be considered specific legal, investment or tax advice. The report does not provide material information about the business and affairs of TD Bank Group and the members of TD Economics are not spokespersons for TD Bank Group with respect to its business and affairs. The information contained in this report has been drawn from sources believed to be reliable but is not guaranteed to be accurate or complete. This report contains economic analysis and views, including about future economic and financial markets performance. These are based on certain assumptions and other factors and are subject to inherent risks and uncertainties. The actual outcome may be materially different. The Toronto-Dominion Bank and its affiliates and related entities that comprise the TD Bank Group are not liable for any errors or omissions in the information, analysis or views contained in this report, or for any loss or damage suffered.

Financial News for the Week of March 4th, 2022
FINANCIAL NEWS HIGHLIGHTS OF THE WEEK
- The labor market added 678k jobs in February, and the unemployment rate fell to 3.8% - the lowest reading since the pandemic began.
- Early indicators suggest that manufacturing and services sectors were out of sync in February, with the former accelerating and the latter slowing down. The difference is largely attributed to continued weakness in demand for services.
- The Russia-Ukraine War continues to reverberate through financial markets, lifting commodity prices and threatening to tighten financial conditions further. The Fed is likely to raise interest rates in March, but the speed of future rate hikes is more uncertain.
U.S. -Economy Marches On, Volatility Spikes due to the Russia-Ukraine War
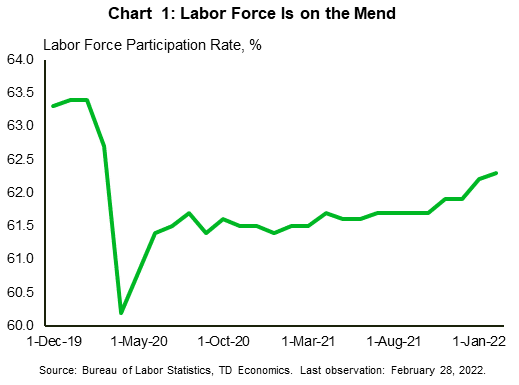
It’s the first week of March, which means we get the initial glance at how the economy did in February, when the Omicron wave started to ease in financial news. This morning, the U.S. Bureau of Labor Statistics surprised the market with 678k jobs created in February, well above 400k anticipated by forecasters. This was on top of an upward revision of 92k to December and January. The unemployment rate fell to 3.8 % – the lowest reading since the pandemic, just 0.3 percentage points above the level two years ago. The labor force – a measure of people working or actively looking for work – also made progress. The labor force participation rate ticked up to 62.3% after 304k people joined labor force in February (Chart 1). All in all, labor market is getting tighter and tighter.
In the meantime, leading business indicators diverged. As measured by the ISM Index, the manufacturing sector reversed three months of decline, accelerating to 58.6. Demand was solid, with new orders moving above 60 again. Production accelerated, but it could have been even stronger without materials supply constraints. The backlog of orders index jumped by almost 9 percentage points (ppts), while supplier deliveries inched 0.5 ppts higher. Despite all these challenges, inventory rebuilding continued, albeit at a very slow pace adding only 0.4 percentage points in February.
Surprisingly, the services sector slowed in February, with the two demand indicators – business activity and new orders – declining to mid-50 levels, last seen exactly one year ago. The consensus anticipated a modest increase, expecting that the fading threat of Omicron would help the services sector bounce back. Respondents blamed the post-holiday fatigue and difficult business conditions, affected by capacity constraints, inflation, logistical challenges, and labor shortages. Indeed, supply-side indicators deteriorated as delivery times slowed again while the employment index moved back into the contractionary territory.
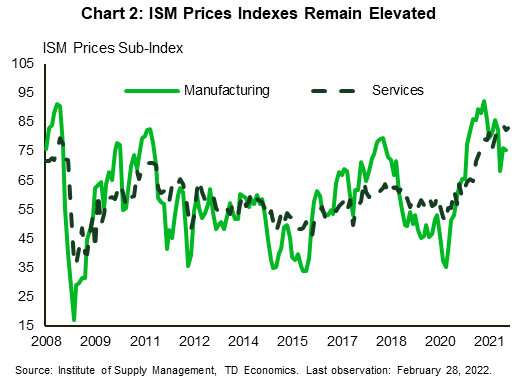
The price sub-indexes remained elevated, although price pressures seem to track lower in the manufacturing sector, while services continue to struggle with a reading above 83 (Chart 2). Despite these differences, there is little doubt that next week’s CPI reading will come in much higher than the 2% target. With the threat of higher prices becoming more entrenched, the Fed is unlikely to hesitate to raise the fed funds rate by 25 basis points on March 16th.
Meanwhile, Russia’s invasion of Ukraine has reverberated through financial markets, lifting a key measure of volatility to the highest level in more than a year. Although the U.S. trade dependency on Russian and Ukrainian products is limited to less than 1% (according to the World Bank), the U.S. economy may suffer through other channels. The conflict has already resulted in the biggest weekly surge in commodity prices since 1974, and threatens to exacerbate pandemic-induced logistical challenges in financial news. Both of these forces will lead to higher prices, and a drag on economic growth. Meanwhile, further deterioration in financial conditions would be equivalent to monetary tightening, which could force the Fed to slow down the speed of rate hikes in the future.
Maria Solovieva, CFA, Economist | 416-380-1195
This Financial News report is provided by TD Economics. It is for informational and educational purposes only as of the date of writing and may not be appropriate for other purposes. The views and opinions expressed may change at any time based on market or other conditions and may not come to pass. This material is not intended to be relied upon as investment advice or recommendations, does not constitute a solicitation to buy or sell securities and should not be considered specific legal, investment or tax advice. The report does not provide material information about the business and affairs of TD Bank Group and the members of TD Economics are not spokespersons for TD Bank Group with respect to its business and affairs. The information contained in this report has been drawn from sources believed to be reliable but is not guaranteed to be accurate or complete. This report contains economic analysis and views, including about future economic and financial markets performance. These are based on certain assumptions and other factors and are subject to inherent risks and uncertainties. The actual outcome may be materially different. The Toronto-Dominion Bank and its affiliates and related entities that comprise the TD Bank Group are not liable for any errors or omissions in the information, analysis or views contained in this report, or for any loss or damage suffered.

Financial News for the Week of February 25th, 2022
FINANCIAL NEWS HIGHLIGHTS OF THE WEEK
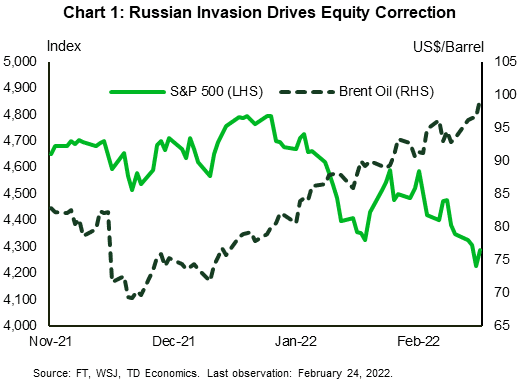
- The Russian invasion of Ukraine shook markets this week with the S&P 500 entering correction territory before making gains Friday. Given Russia’s role as a key global energy producer, market concerns about supplies have driven prices for oil and natural gas higher.
- For the U.S., the most immediate impact will come from higher oil prices, which will keep inflation elevated and weigh on growth. The impact will depend on how long the conflict lasts.
- Barring severe market disruption, we still expect the Fed to hike rates in March. The core PCE deflator reached 5.2% year-on-year in January, underscoring that the Fed is behind the curve on inflation and can’t wait for the perfect time to hike.
U.S. -All About Inflation and Geopolitics
Regrettably, Russia made risk reality this week, launching an all-out invasion of Ukraine in geopolitical and financial news. The threat of Russian military aggression had been souring market sentiment for several weeks now, and the invasion worsened declines in equity markets and sent energy prices higher (Chart 1). The S&P 500 entered correction territory this week, relative to its early January highs, and was down 0.2% at time of writing versus a week ago. With Russia’s role as a key global energy supplier, worries about energy supply have driven prices for oil and natural gas higher. The Brent crude benchmark crossed the $100 per barrel threshold for the first time since 2014.
Market selloffs at the outset of wars have historically been short and reversed quickly. That said, there is still likely to be an economic toll on global growth from the conflict, with Europe likely to take the biggest hit. The outcome depends on how long the conflict goes on, and market reaction. We outlined some potential scenarios in our recent report Questions? We’ve Got Answers.
For the U.S., the most immediate impact will come from higher oil prices. These will keep inflation elevated and weigh on purchasing power longer than previously expected. We expect prices to ease as the conflict does, but how long it lasts is highly uncertain. The West Texas Intermediate oil price is around $92 per barrel at time of writing, up over 20% from the start of the year. If it were to remain above $90 per barrel for the remained of the year, it would shave a few tenths off of real GDP growth in 2022. We are currently tracking real GDP to grow of 2.8% in 2022 (Q4/Q4), so a slightly softer pace would still be a solid pace for growth.
The conflict in Europe comes just three weeks ahead of what is widely expected to be the Federal Reserve’s first interest rate hike. The war is unlikely to prevent the Fed from taking its policy rate off the floor. At 0.5%, the federal funds rate will remain highly stimulative. The Fed is behind the curve on inflation and can no longer wait for the perfect moment to begin normalizing policy.
On that front, the core personal consumption expenditure (PCE) deflator – the Fed’s preferred indicator – was up 5.2% in January, the fastest rate in nearly 40 years. While a bit lower than the 6% increase in the core CPI, it is still a lot higher than the Fed would like. Monetary policy works with a lag and rate hikes this year will not do much to reduce inflation until next year. In the meantime, a lot has to go right to slow inflation’s roll. This increases the urgency to raise rates now or risk unmooring expectations and having to hurt the economy more later in order to rein them back in.
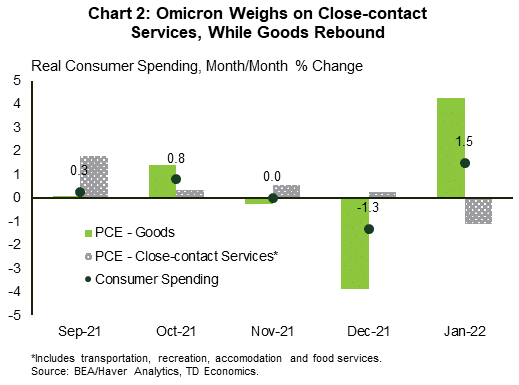
One piece of good financial news this week was a solid rebound in consumer spending in January (Chart 2). The rebound was driven by durable goods, led by spending on vehicles. Spending on close contact services weakened, showing the impact of consumer caution as Covid cases rose. We expect these categories to rebound in February and March, with the high-frequency data already showing that consumers are returning to restaurants and air travel.
Leslie Preston, Director | 416-983-7053
This Financial News report is provided by TD Economics. It is for informational and educational purposes only as of the date of writing and may not be appropriate for other purposes. The views and opinions expressed may change at any time based on market or other conditions and may not come to pass. This material is not intended to be relied upon as investment advice or recommendations, does not constitute a solicitation to buy or sell securities and should not be considered specific legal, investment or tax advice. The report does not provide material information about the business and affairs of TD Bank Group and the members of TD Economics are not spokespersons for TD Bank Group with respect to its business and affairs. The information contained in this report has been drawn from sources believed to be reliable but is not guaranteed to be accurate or complete. This report contains economic analysis and views, including about future economic and financial markets performance. These are based on certain assumptions and other factors and are subject to inherent risks and uncertainties. The actual outcome may be materially different. The Toronto-Dominion Bank and its affiliates and related entities that comprise the TD Bank Group are not liable for any errors or omissions in the information, analysis or views contained in this report, or for any loss or damage suffered.

Financial News for the Week of February 18th, 2022
FINANCIAL NEWS HIGHLIGHTS OF THE WEEK
- Inflation concerns and rising geopolitical tensions took a toll on equity markets this week. Regarding inflation and monetary policy, minutes from the January FOMC meeting indicate that most participants believe that the Fed should hike rates at a faster clip than it did during the post-2015 period.
- Retail sales beat market expectations in January, rising 3.8%. Driving the gain were strong receipts at auto & parts dealers and non-store retailers.
- Housing starts fell 4.1% in January, but on a trend basis remain at the highest level since 2006. Existing home sales were upbeat, rising 6.7% last month. The strong showing likely reflects some pull-forward in activity.
U.S. -All About Inflation and Geopolitics
The week started off on a ‘lovely’ note in financial news, but the high cost of roses – a fairly inelastic good on Valentine’s Day – is likely to have reminded the average consumer once again of the strong inflationary pressures the country is facing. Concerns regarding high inflation, together with rising geopolitical (Ukraine-Russia) tensions added to equity market volatility.
On inflation, minutes from the January 25-26 Federal Open Market Committee (FOMC) meeting showed growing concern over elevated inflation. From our lens, there is no longer a question of whether the Fed will hike rates soon, but by how much. On this front, most participants believed a faster pace of hikes than that of the post-2015 period would likely be warranted this time around. In this vein, St. Louis Fed President Bullard, reiterated this week that without swift Fed action, inflation may become an even more serious problem. Bullard has advocated for the front-loading of rate hikes, calling for a cumulative full percentage point hike over the next three meetings. Market odds were in tune with some front-loading last week, briefly tilting towards a 50-basis point hike in March, but have since cooled.
The Fed’s hiking pace will ultimately be heavily dependent on how the economy and especially interest rate sensitive sectors, such as housing, respond to higher rates. A series of data reports this week drove in the point that the economy started 2022 on decent footing. Retail sales surged 3.8% month-to-month in January, well above the market consensus forecast for a 2.0% print. Driving the gains were higher receipts at auto & parts dealers (5.7%) and non-store retailers (+14.5%). The latter, a proxy for online sales, is likely to have benefitted from a surge in infections last month.
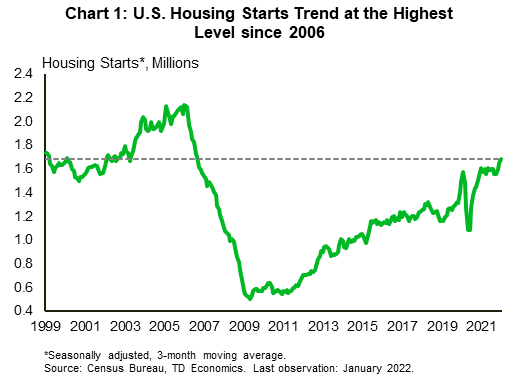
Homebuilding activity, meanwhile, had a soft start to the year, with housing starts falling 4.1% (m/m) in January. Judging by the many obstacles that builders face, such as material and labor shortages, this result isn’t entirely unwarranted. Rising absenteeism among infected workers during January’s Omicron wave is also likely to have weighed on the pace of new construction. Yet, it’s important to not lose the forest for the trees. On a trend basis, homebuilding activity remains near the highest level since 2006, while homebuilder confidence remains near its highest level on record (Chart 1).
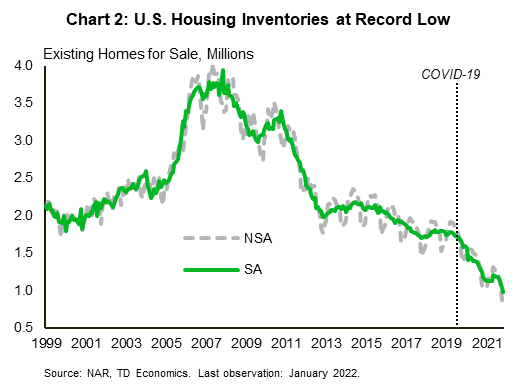
The severe housing supply shortage is supporting builder optimism and new residential construction activity in financial news. Existing home sales surged 6.7% (m/m) in January, defying market expectations for a decline. This strong sales pace bit into inventories, sinking them to the lowest level on record (Chart 2). The imbalance is likely to keep builders busy for quite some time. January’s strong showing also likely represents some pull-forward in activity with homebuyers trying to get ahead of higher mortgage rates. This may come at the expense of a slower sales pace later in the year. The intuition of higher rates, however, has proven correct, with average 30-year mortgage rates surging to around 4% in recent weeks. As the Fed pulls away from ultra-loose monetary policy, higher rates will weigh on affordability, which will take some additional steam out of demand. This is but one reason as to why the Fed’s hiking pace will bear careful watching.
Admir Kolaj, Economist | 416-944-6318
This Financial News report is provided by TD Economics. It is for informational and educational purposes only as of the date of writing, and may not be appropriate for other purposes. The views and opinions expressed may change at any time based on market or other conditions and may not come to pass. This material is not intended to be relied upon as investment advice or recommendations, does not constitute a solicitation to buy or sell securities and should not be considered specific legal, investment or tax advice. The report does not provide material information about the business and affairs of TD Bank Group and the members of TD Economics are not spokespersons for TD Bank Group with respect to its business and affairs. The information contained in this report has been drawn from sources believed to be reliable, but is not guaranteed to be accurate or complete. This report contains economic analysis and views, including about future economic and financial markets performance. These are based on certain assumptions and other factors, and are subject to inherent risks and uncertainties. The actual outcome may be materially different. The Toronto-Dominion Bank and its affiliates and related entities that comprise the TD Bank Group are not liable for any errors or omissions in the information, analysis or views contained in this report, or for any loss or damage suffered.

The Best Ways for Couples To Manage Finances
The Best Ways for Couples to Manage Finances
We asked financial experts—and readers—how they handle money in their own relationships. There are valuable lessons here for everybody.
Money can be one of the most contentious aspects of a relationship or marriage. One in five couples identifies money as their greatest relationship challenge, according to a 2021 Fidelity Investments survey of individuals ages 25 years and older in a married or long-term committed relationship.
Sometimes the challenge is about who spends too much or who doesn’t save enough. But perhaps the most difficult issue is more basic than that. It’s about how to combine finances, if at all. Is it better to keep everything separate? And if you do join forces, who keeps track of the spending and saving, and how do you do it?
Of course, there is no single right or wrong way for couples to divvy up their finances and financial duties. How tasks and decision-making are split can depend on a partner’s existing financial know-how, interest or willingness. Some people want a 50/50 split of duties; some defer all tasks to one partner. Others, meanwhile, have each partner focus on their individual strengths: One person may be a good at the nitty-gritty of budgets and bills while the other is a big-picture thinker when it comes to money.
We wanted to know the different approaches that couples and partners take. To that end, we asked three groups of people to tell us what they do in their own relationships: professional advisers, academics who study financial behavior, and Wall Street Journal readers. Here are some of their responses about finances.
There’s my money, and there’s your money
Unlike many working professionals, when we got married, my husband and I decided not to combine our finances. Although there is some empirical research showing that people who combine their bank accounts feel a greater sense of “financial togetherness,” which can in turn promote relationship satisfaction, we prefer the feeling of personal control that comes with maintaining separate bank accounts.
We use an expense tracker to equally split bills and daily expenses. When it comes to personal items—like new clothes or videogames—we purchase those from our independent accounts. This means we don’t have to ask our partner for permission to make the occasional luxury or experiential purchase. Importantly, this approach to keeping our bank accounts separate doesn’t mean we don’t talk about financial decisions. When it comes to both major decisions like investing and minor decisions like making purchases for our home or buying a toy for our pet, we make these decisions together. Our general rule is that if the other person is going to split the expense, we ask for their input before making the purchase. Our daily purchase discussions about needs and wants for our family allow us to experience financial togetherness, despite having separate bank accounts.
—Ashley Whillans, assistant professor at Harvard Business School
Three different buckets
In our family, it’s all about setting up a “divide and conquer” strategy while maintaining our unique financial independence. We combine our income and it essentially hits three buckets monthly—after we’ve saved 20% off the top. Bucket No. 1 (a joint checking account) is used to pay monthly bills. That gets 70% of the income. Bucket No. 2, which gets 5%, is a savings account for my spouse for buying gifts, entertainment or personal items. Bucket No. 3, which also gets 5%, is a savings account that allows me to do the same. Giving each partner a safe financial space—where they can have some money to do what they want when they want without having to ask—is a really important step to a healthy marriage when it comes to money.
My spouse is the chief financial officer and manages paying the monthly bills. She’s also in charge of making vendor changes when she feels it’s appropriate. My role is the chief investment officer, and I’m responsible for picking our investments, managing our real estate and allocating our 401(k)s. We act as a joint team when it comes to making financial decisions regarding our children—whether it’s allowances, mobile phones or the credit cards they use.
We act as co-CEOs when it comes to mapping out financial family goals and objectives. Each year, we assess our one-year goals in terms of savings, net worth or possible purchases. We review our long-term financial plan to make sure we are on track for goals such as college education and retirement. Having an open and transparent relationship with our money has allowed us to minimize arguments and discrepancies and focus on maximizing our mutual financial goals.—Ted Jenkin, co-CEO and founder of oXYGen Financial in Savannah, Ga.
It’s all in the prenup
My husband and I have a prenuptial agreement and we are both responsible for our own debts. Because we live in my husband’s condo, he pays the mortgage. I pay the association fee and buy the groceries. I am also responsible for my own car payment and car insurance. I collect rent from my former home. We both had assets when we got married, and he does have children from a prior marriage, so this arrangement seems very sensible for us. We both have separate bank accounts and credit cards. In addition, we have separate retirement accounts—both personal and from our employers.
When we purchase a house together (currently under construction), we should maintain our current arrangement, minus the mortgage; we’ll just divide the mortgage payment in proportion to our salaries. If we eventually sell the house, we will split the proceeds depending on how much we’ve invested in it individually.
—WSJ reader Jessica Moran, Fullerton, Calif.
A monthly financial meeting
My husband and I have been together for over 10 years and combined our finances after we married in 2015. One tradition we introduced when we started living together was to have a conversation about our finances the first day of each month when we develop a spending plan that we create on a shared Google spreadsheet.
In the spreadsheet, each row represents a smaller category of purchases like groceries, entertainment, and clothing that we earmark a certain amount of money toward for the month. We then log any purchases we make on the spreadsheet, and typically don’t discuss these purchases unless they are unexpected and large (like a dental bill). During our monthly financial meeting, we assess how we did with our spending and adjust for the month going forward. We added two new categories to our plan this year: a personal spending account for me and one for him. These accounts allow us a bit of privacy if we make a purchase we don’t necessarily want to share. (This was introduced after our tracking system ruined the surprise of gifts we gave each other over the holiday.)
Tracking all our purchases was painful when we first introduced it, because it focused us on the pain of parting from money. But it quickly became a source of strength, because it has encouraged us to have more regular check-ins with each other about the lives we want and how we can use our money to get us there.
—Grant E. Donnelly, an assistant professor of marketing and logisticsat Ohio State University’s Fisher College of Business

Joint accounts (except for retirement)
I am the appointed CFO in my household. I remember when I approached my wife and kindly suggested that we hire a financial planner to take a fresh look at our own financial planning. She replied, “Isn’t this what you do?”
We handle both of our incomes in a joint checking account from where expenses are paid. From this checking account, we have monthly electronic transfers going out to an online bank joint savings account for short-term goals. Other transfers go out to brokerage accounts for longer-term goals. We each have our own retirement plans that I manage.
Every year, we sit down and review every financial account we have. My wife gets a one-page report along with copies of the Dec. 31 statements of each account, which I place in the “If I get hit by the bus” estate-planning folder. To keep working in financial harmony, we have another joint account in the same online bank that gets funded monthly. The balance is available solely to my wife to spend as she pleases. This approach works for us. Harmony and simplicity are worth the peace of mind that follows. And always be mindful of making it easier for your spouse to carry on in case the unthinkable happens.
—George Papadopoulos, fee-only financial planner in Novi, Mich.
Down the middle
My partner and I are very, very 50-50 in how we approach our finances. Anything shared—rent, electricity, internet, etc.—is split right down the middle. I have a system for tracking discretionary expenses, and at the end of the month the total of regular shared monthly expenses and one-off expenses gets split. My partner then pays that amount to our credit-card account(s) used for the monthly spending.
The 50-50 setup leaves neither of us feeling like we’re doing more than the other. We also make close to the same salary, so it feels fair.
—WSJ reader Charlie Donley, Philadelphia
A partnership, with guidance
When my husband, Ken, and I got married, we were well aware that money was one of the two primary issues that can come between couples and commonly lead to divorce (the other being sex). We decided early on to make sure that our finances wouldn’t ruin our marriage or create emotional or financial strife.
First, we tackled the obvious. Regarding living expenses and large purchases, we opened three checking accounts to pay bills: a joint account and individual accounts for each of us. Neither of us wanted to feel judged by our financial purchases nor be told what we could or could not buy. We pay all of our household expenses, including large purchases that we agree on like a car, through a joint account and our discretionary expenses through our personal accounts. I took on the role of managing our household expenses, primarily out of practicality. We each had an individual 401(k) that we contributed to regularly, and we started a joint investment account as well. We fund charitable giving—a big priority for us—through our joint account.
We partnered on investment and charitable-giving decisions and it didn’t take us long to realize that we needed professional guidance to educate us, help us make investment decisions, and, at times, arbitrate between us to determine the right financial strategies. While it’s not a conflict-free strategy, it has really worked well for us.
—Maddy Dychtwald, author and co-founder of Age Wave think tank and consultancy
Proportionate spending
My wife and I have a joint account that all of our bills are auto-drafted from every month. Our mortgage, utilities, insurance, auto loans, everything. We figured what the total would be and then figured our proportionate income for the household. For example, my income accounts for 70% percent of the total household income. So, if our monthly bills are $4,000, I would contribute $2,800, or 70%, each month to the joint account and she would contribute her $1,200, or 30%. We did it this way so it would be fair and no one would feel like they are over-contributing or under-contributing, because it’s all relative and subjective.
We also take 10% of any commission or bonuses and put it straight into savings. The remainder is put into our individual accounts for daily life. We use that money for buying whatever we want. It prevents the other person from being upset if they feel too many Amazon packages are showing up at the door.
—Daniel Rodriguez, chief operating officer at Hill Wealth Strategies in Richmond, Va.
A family finance meeting (kids included)
I did all of the finances at the beginning of our marriage. However, this inequity turned into a weird dynamic where my spouse felt like she needed to ask for permission to spend money. So, five years ago we developed a budget and financial scorecard.
Monthly, we track income, expenses and our personal balance sheet (assets, liabilities and net worth). The kids are involved in our financial meetings, where we discuss how much we plan on spending for vacations, eating out, etc. One month, the kids were overspending on school lunch ($400 for the month), so they proposed we make home lunches for the next month to balance things out. It has been a really awesome habit for our family and our net worth has increased 8x during the last five years.
—WSJ reader Regan Fackrell, St. George, Utah
Team effort
It’s important that we are a team on our spending and saving, rather than the husband paying for certain expenses and the wife paying for other expenses. That approach tends to create conflict. So we have both of our direct deposits going to the same checking account, from which we pay for all of our fixed household expenses, and most importantly, our goals. We also have a joint credit card for all other spending. We decide that if we’re going to make a purchase above a certain dollar amount—for example more than $500—we first discuss it so there are no surprises. We also take into consideration gifts for one another, such as for holidays and birthdays. During this time, we have an unwritten agreement that we don’t check credit-card statements so that there is still an element of surprise.
—Lisa Tuttle, Ameriprise financial adviser and co-owner of the Tuttle Group, Edina, Minn.
Separate and competitive
My girlfriend, Samantha, and I have been in a relationship for 12 years and have kept our finances completely separate. We use [money-management site] Mint to compare net worth to see which one of us is more effectively managing their portfolio. Whenever our combined net worth eclipses a new $100,000 milestone, we grab a celebratory meal. Who pays? Honestly, Sam usually pays. Otherwise, we’ll split the check using Venmo.
—WSJ reader Dave Cooper, Milwaukee, Wis.
Cold, clinical and intimate
The financial three-way: yours, mine, ours. This is the guiding framework that my partner, Jay, and I use to handle our finances. We are both in our 50s, divorced, and thanks to this system have not had a single money argument over the five plus years we’ve been together.
We decide what expenses we want to treat as combined and we each pay 50% of those costs. That bucket includes: costs related to the condo we own jointly, vacations we take together, and any other forms of entertainment we do as a couple. We then keep the remainder of our finances—both the savings/investments we accumulated prior to meeting as well as each of our current income streams—in our own separate accounts. We use that money as we see fit, from charitable giving to personal grooming.
On the surface, this may seem to be a very cold and clinical manner of handling finances. But in reality, it is shockingly intimate as it requires you to get financially naked and really talk about money with your partner.
—Manisha Thakor, founder of financial well-being consultancy MoneyZen in Portland, Ore.
Redundant, just in case
My wife, Patty, is the chief financial officer and takes the lead in paying bills and handling the majority of our banking. I’m the chief investment officer and do nearly all of the investing as well as taxes. But we build redundancy for two reasons—to make sure one of us doesn’t make a major mistake and so one of us can take over should the other be incapacitated.
We discuss major expenditures and reach agreement before such an outlay. Often times, we compromise. Patty will sometimes catch fraudulent expenditures or ongoing monthly charges for services we rarely use. She keeps our credit score high by paying bills on time.
As the CIO, I typically handle investments though, again, I don’t make any major moves without my wife’s buy-in. For example, I rebalanced during the Covid plunge back in March 2020, but only after her consent. We both have access to all accounts. We are not just partners in life; we also have a partnership in our finances.
—Allan S. Roth, founder of Wealth Logic, Colorado Springs, Colo.
Together, then separate, then together
We’ve been married 21 years. Initially, we just had a joint account we each contributed to, to cover the mortgage, utilities and other fixed costs. Then we went more separate for five years or so in divvying up certain items—and that didn’t work as well in working to plan and stay on track for our goals. It even created tension in our marriage.
Now, I run the finances for the family and share our budget and our overall financial picture regularly with full transparency. That allows us to discuss and make decisions that work for today and tomorrow. I use the 50/30/20 approach—50% of earnings go to essential needs (shelter, food, utilities), 30% to wants (entertainment, travel, etc.), and 20% to savings (retirement, house, car, emergencies)—and explain how as we work to pay off the mortgage, wants and savings will get a greater percentage than the target.
—WSJ reader Stuart Robertson, Seattle
Preventing ‘frugal fatigue’
My wife and I have slightly different salaries with all sources of income deposited into a single joint account. Each month, we have a short budget meeting, during which we talk about unique expenses for that month—birthday parties, church events, summer camp and so forth. Sometimes, a little debate is inevitable. We set aside extra funds for those things, take a quick glance at the usual expenses and then move on.
We have a dollar amount above which discretionary purchases for the household are made jointly. And we give ourselves a certain amount of pocket cash and move some money into our personal accounts. When we were just starting out, the discretionary spending limit was $50, pocket cash was $20 a week and personal accounts had only a few hundred dollars. To prevent frugal fatigue in those early years, we made ourselves spend a small amount each week on a date night or fun activity. Obviously, those amounts grew over time, but we still stick to these strategies because they’re what got us here.
—John Graves, founder and managing partner of G&H Financial Group, North Canton, Ohio
Ms. Lourosa-Ricardo is a features editor for The Wall Street Journal. Write to cristina.lourosa@wsj.com
This article was originally provided by WSJ to view the original article please click here.
Copyright ©2022 Dow Jones & Company, Inc. All Rights Reserved. Ms. Lourosa-Ricardo is a features editor for The Wall Street Journal. Write to cristina.lourosa@wsj.com
Appeared in the February 14, 2022, print edition as 'THE BEST WAYS FOR COUPLES TO SHARE FINANCES.'

Financial News for the Week of February 11th, 2022
FINANCIAL NEWS HIGHLIGHTS OF THE WEEK
- U.S. prices continued to heat up in January as headline inflation accelerated to 7.5% year-on-year from 7.0% in December. Excluding food and energy, core prices also rose notably over the year to 6.0% with broad-based increases across index components.
- High inflation has firmed market expectations for aggressive tightening of monetary policy as the Fed is set to meet in mid-March. Financial markets responded with bonds yields generally heading higher, while equities retreated.
- For 2021, the U.S. posted a record trade deficit of $859 billion as imports surged.
U.S. -All Eyes on the Price
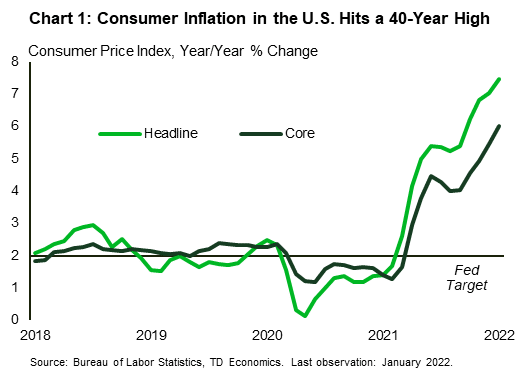
In financial news it was all about inflation this week, as the January CPI surpassed expectations and markets recalibrated their expectations for rate hikes. Headline inflation accelerated 0.5 percentage points to 7.5% year-on-year (y/y) in January, reaching the highest level in 40 years (Chart 1). Strong consumer demand coupled with pandemic-related supply constraints resulted in the strong price gains. Core prices were also up significantly relative to year ago levels at 6.0% (up from 5.5% in December). Price increases were relatively broad based across the index, with categories such as used motor vehicles (up 40.5%) and gasoline (up 40%) recording some of the largest gains versus a year ago.
Inflation is increasingly a top concern for small businesses. A survey of independent businesses showed that 22% of owners viewed inflation as their single most important problem in January. This matched the highest level previously recorded in 1981. High input prices coupled with rising labor costs are cutting into small firms’ profits. In response, 61% of firms reported having already raised prices. However, fewer firms (a net 47%) are planning to do so in the next three months, suggesting that firms may be nearing their limit for passing on cost increases to consumers.
Financial markets also responded to the inflation report as equities fell and yields on the 10-Year Treasury touched 2% for the first time since 2019. These movements occurred on the expectation that persistent high inflation will result in tighter Fed policy. The market-implied probability of at least a 50-basis point rate hike at the Fed’s March meeting shifted to over 50% after the report, from 24% the day before, suggesting expectations of more aggressive tightening.
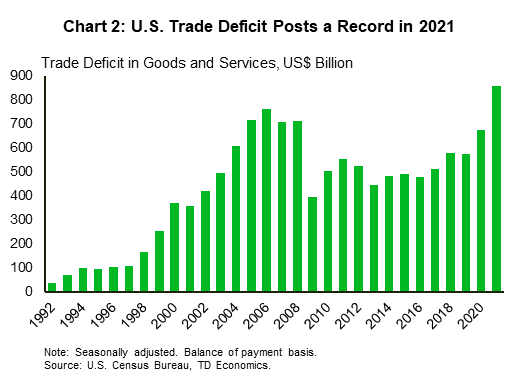
In other data, the U.S. trade deficit widened from $79.3 billion in November to $80.7 billion in December. The nation hit a record trade deficit of $859.1 billion for the full calendar year – a 27% increase over 2020 and blowing past the previous record of $763.5 billion in 2006 (Chart 2) in further financial news. For the year, imports were up 20.5% while exports grew by 18.5%. The notable rise in the trade deficit, highlights the strength of the U.S. economy as it rebounded from the pandemic. Consumers, supported by generous fiscal policy, shifted their spending patterns more towards goods over services during the pandemic, and consumer goods are heavily imported.
As the pandemic enters its third year, governments and citizens are more and more learning to just live with it. Many states, including California, Oregon, New Jersey, Connecticut, Delaware, New York, Illinois, Massachusetts and Rhode Island, have announced that rules requiring masks and/or proof of vaccinations will end by March. Local governments and school boards, however, have the discretion to maintain their own requirements.
These announcements are a step towards returning to normal, even as recently introduced cross-border vaccine mandates for truck drivers have sparked protests resulting in blockage of the busiest land border crossing between the U.S. and Canada. The slowdown at the Ambassador bridge crossing caused several car manufacturers to halt or slow production due to delays in delivery schedules. As the border re-opens and normal flow of traffic resumes, these disruptions are expected to dissipate.
Shernette McLeod, Economist | 416-415-0413
This Financial News report is provided by TD Economics. It is for informational and educational purposes only as of the date of writing, and may not be appropriate for other purposes. The views and opinions expressed may change at any time based on market or other conditions and may not come to pass. This material is not intended to be relied upon as investment advice or recommendations, does not constitute a solicitation to buy or sell securities and should not be considered specific legal, investment or tax advice. The report does not provide material information about the business and affairs of TD Bank Group and the members of TD Economics are not spokespersons for TD Bank Group with respect to its business and affairs. The information contained in this report has been drawn from sources believed to be reliable, but is not guaranteed to be accurate or complete. This report contains economic analysis and views, including about future economic and financial markets performance. These are based on certain assumptions and other factors, and are subject to inherent risks and uncertainties. The actual outcome may be materially different. The Toronto-Dominion Bank and its affiliates and related entities that comprise the TD Bank Group are not liable for any errors or omissions in the information, analysis or views contained in this report, or for any loss or damage suffered.

Financial News for the Week of February 4th, 2022
FINANCIAL NEWS HIGHLIGHTS OF THE WEEK
- This week provided the first glance at the economic impact of Omicron, which seems relatively benign compared to previous outbreaks. The poster child of this week is employment, which pulled off an Olympic medal’s worth performance, adding 467k jobs in January.
- On the business side, both the manufacturing and services sector remained in expansionary territory, while auto sales surprised with solid growth, reaching the highest level in seven months.
- Stock prices gyrated in sync with the earnings performance of individual tech companies. The bond market, meanwhile, reacted strongly to the employment data, with yields rising by 13 basis points for the week.
U.S. -Economy Endures Omicron
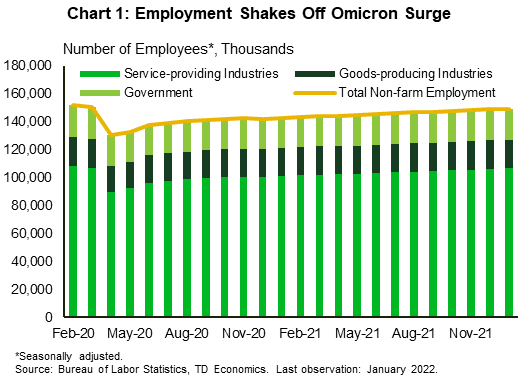
This week in financial news provided the first glance at the economic impact of Omicron. As it turns out, the damage wasn’t as bad as feared, at least according to early economic indicators. Hot off the press, the jobs report came in faster, higher and stronger than anticipated by the market consensus. The economy pulled off an Olympic medal’s worth performance, adding 467k jobs in January (Chart 1). December and November data were revised up adding another 709k, bridging the employment gap to less than 2% of its pre-pandemic level. The laggard industry remains leisure and hospitality, where employment rose by 151k, but remains well below its pre-pandemic peak.
This week’s Institute for Supply Management (ISM) reports filled in the narrative from the business perspective. Both the manufacturing and services sector indexes slowed in January, but continued to expand at an above-trend rate, with readings of 57.6% and 59.9%, respectively . As expected, Omicron weighed on demand, with services business activity dropping by 8.4 percentage points (ppts) and manufacturing production softening by 1.6 ppts. Some demand softening is a blessing in disguise as it helped reduce backlogs of orders, which dropped by 6.4 and 4.9 ppts for manufacturing and services sectors, respectively. Notably, demand for services still has room to grow, as it has not yet fully recovered from pandemic-related restrictions. Once the threat of Omicron fades, consumers are likely to direct more of their spending to services, giving the sector some added oomph.
At the same time, supply constraints may take a longer time to attenuate. Supplier delivery times remained relatively flat for manufacturing and increased marginally for the services sector (following a sizeable reduction in December in financial news). The tone of respondents’ comments on disruptions hardly lost its zing as the “lack of supplier manpower” continues to push prices up, affecting industries across the economy.
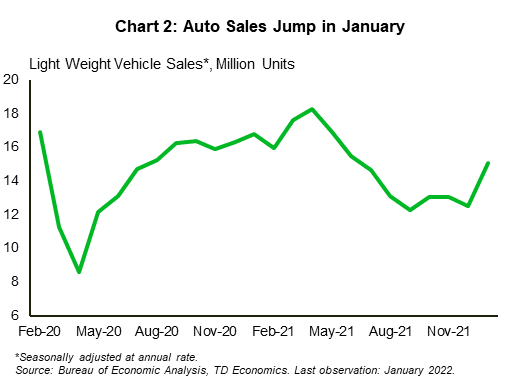
Nowhere is the impact of supply disruptions on prices more apparent than in the auto sector. This week, auto sales surprised with solid growth, reaching the highest level in seven months (Chart 2). The improvement can be attributed to a solid recovery in production, which was able to reduce the pre-pandemic gap from 30% in September to 8% in December. While chip shortages continue to affect the industry, anecdotal evidence suggests that Omicron has so far had a less dire impact on semiconductor supply chains compared to Delta.
All in all, early economic data suggest that the negative impact of the virus continues to diminish with each subsequent wave. Nevertheless, the equity market continued skating on thin ice as stock prices gyrated in sync with the earnings performance of individual tech companies. The bond market, meanwhile, reacted strongly to the employment data with yields rising by almost 10 basis points (bps) to an overall increase of 13 bps for the week (as of writing). This makes sense. With few signs of waning strength in the labor market, a data-dependent Fed is likely to act decisively to raise the federal funds rate starting at its next meeting in March. Balance sheet normalization shouldn’t be too far behind, but its pace is likely to be “gradual and not disruptive”, in the words of San Francisco Fed’s President Mary Daly.
Maria Solovieva, Economist | 416-380-1195
This Financial News report is provided by TD Economics. It is for informational and educational purposes only as of the date of writing, and may not be appropriate for other purposes. The views and opinions expressed may change at any time based on market or other conditions and may not come to pass. This material is not intended to be relied upon as investment advice or recommendations, does not constitute a solicitation to buy or sell securities and should not be considered specific legal, investment or tax advice. The report does not provide material information about the business and affairs of TD Bank Group and the members of TD Economics are not spokespersons for TD Bank Group with respect to its business and affairs. The information contained in this report has been drawn from sources believed to be reliable, but is not guaranteed to be accurate or complete. This report contains economic analysis and views, including about future economic and financial markets performance. These are based on certain assumptions and other factors, and are subject to inherent risks and uncertainties. The actual outcome may be materially different. The Toronto-Dominion Bank and its affiliates and related entities that comprise the TD Bank Group are not liable for any errors or omissions in the information, analysis or views contained in this report, or for any loss or damage suffered.