
Financial News for the Week of June 3rd, 2022
Financial News Highlights
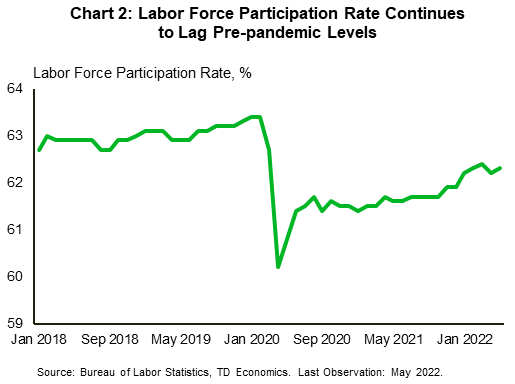
- The U.S. economy continued to add jobs in May, though at a slower pace than in the previous month. The unemployment rate held steady at 3.6% and the labor force participation rate edged up by 0.1 percentage point.
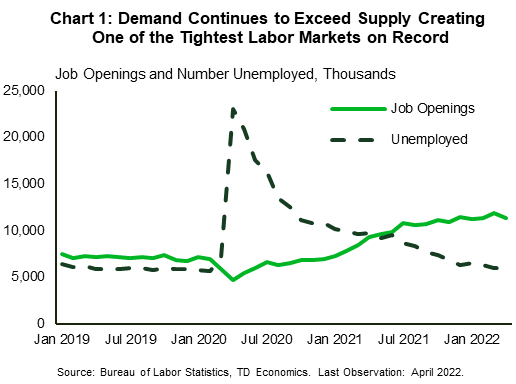
- Job openings remained elevated at 11.4 million, even while workers continued to quit their jobs. With job openings exceeding the number of unemployed workers, labor market conditions may remain tight for some time yet.
- Both manufacturing and services activity continued to expand in May, though services did so at a slower rate. Both sectors also felt the hiring pinch, as the availability of workers dwindled.
U.S. -Jobs Abound but Too Few Workers Around
This week marks the start of a new month and with it, the start of the Fed’s quantitative tightening program in financial news. As it tightens monetary policy to fight inflation, the Fed will allow up to $47.5 billion of its treasury and mortgage-backed securities holdings to mature this month without reinvesting the proceeds. The net effect should help to push rates higher and tighten financial conditions, helping ease price pressures.
The Fed’s Beige Book also reported that companies continued to struggle with rising prices and labor shortages during the spring, resulting in modest economic growth. The report notes however, that consumers are starting to push back on higher prices, thereby limiting companies’ ability to fully pass on cost increases. To deal with labor shortages some businesses implemented greater automation, offered more job flexibility, and/or increased wages.
Job opening data for April further reinforced the tight labor market narrative. There were 11.4 million job openings in April, a pullback from the 11.9 million record attained in the previous month, but still well above pre-pandemic figures. Churn in the market remained elevated with workers quitting their jobs 4.4 million times, little changed from the prior month. The number of job openings has exceeded the number of unemployed persons looking for work for much of the past year (Chart 1) as fewer persons are seeking employment relative to before the pandemic.
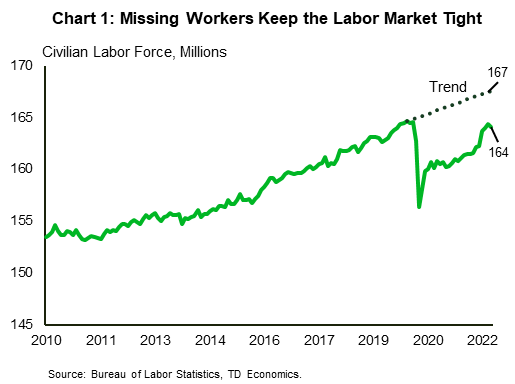
The trend is set to continue as the U.S. added 390k jobs in May, lower than the 436k in April but ahead of market expectations for 325k (see here). Job gains were notable in leisure and hospitality, professional and business services, and in transportation. Notably, employment in retail trade declined. The unemployment rate held steady at 3.6% – close to the 50-year low of 3.5%. While the labor-force participation rate continued to recover at 62.3%, it was still below the 63.4% attained prior to the pandemic, thereby contributing to the labor supply slump (Chart 2).
The ISM manufacturing survey showed that activity in the sector continued to accelerate in May despite supply-chain and pricing challenges (see here) in financial news. The index came in at 56.1, exceeding April’s 55.4 print. New orders, backlogs of orders and the production index all rose, reflecting manufacturers’ struggles to keep up with above-trend demand for goods.
Conversely, while still in growth territory, activity in the services sector decelerated in May to 55.9 from 57.1 (see here). Despite new orders being higher on the month, business activity pulled back 4.6 points to a two-year low of 54.5. Services activity is expected to pick-up speed as summer progresses, though rising prices present challenges.
Despite current strong economic conditions, consumer confidence took a hit for the second consecutive month as high inflation soured the outlook. The Conference Board consumer confidence index dipped to 106.4 in May, from 108.6 in April, with both the present situation and the expectations index declining. Rising inflation, and measures to counteract it, may be putting a damper on consumers as they brace for the possible fallout.
Shernette McLeod, Economist | 416-415-0413
This Financial News report is provided by TD Economics. It is for informational and educational purposes only as of the date of writing and may not be appropriate for other purposes. The views and opinions expressed may change at any time based on market or other conditions and may not come to pass. This material is not intended to be relied upon as investment advice or recommendations, does not constitute a solicitation to buy or sell securities and should not be considered specific legal, investment or tax advice. The report does not provide material information about the business and affairs of TD Bank Group and the members of TD Economics are not spokespersons for TD Bank Group with respect to its business and affairs. The information contained in this report has been drawn from sources believed to be reliable but is not guaranteed to be accurate or complete. This report contains economic analysis and views, including about future economic and financial markets performance. These are based on certain assumptions and other factors and are subject to inherent risks and uncertainties. The actual outcome may be materially different. The Toronto-Dominion Bank and its affiliates and related entities that comprise the TD Bank Group are not liable for any errors or omissions in the information, analysis or views contained in this report, or for any loss or damage suffered.
To see more news reports, click here.

Financial News for the Week of May 27th, 2022
Highlights
- The second estimate of U.S. GDP growth confirmed that the economy contracted in the first quarter of the year, pulling back by 1.5% relative to the 1.4% reported previously.
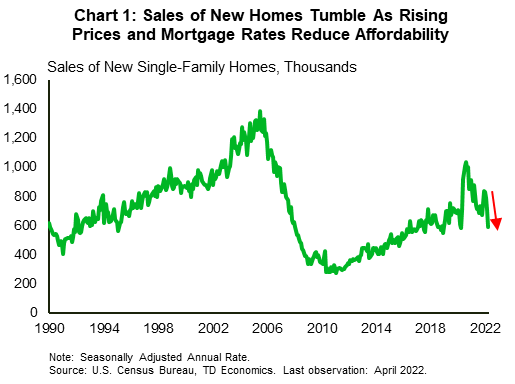
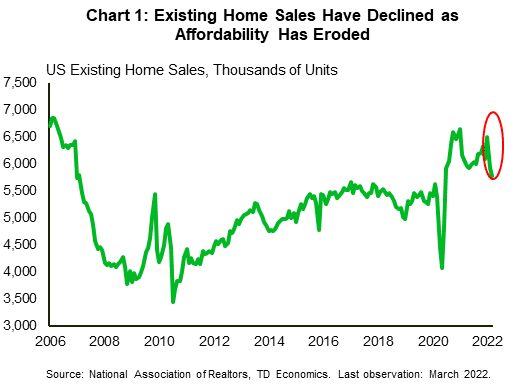
- The housing market continued to show signs of buyer wariness as rising prices and mortgage rates erode affordability, resulting in slumping sales both for new and existing properties.
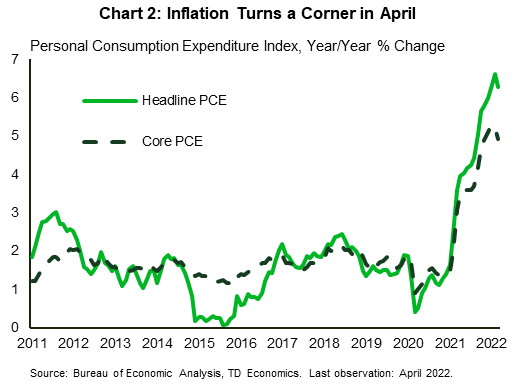
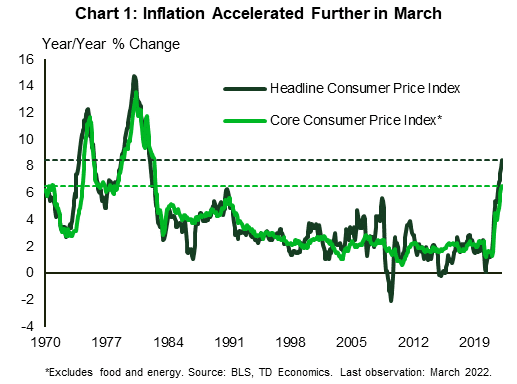
- U.S. consumers continued to post growth in both nominal income and spending in April. Continued price pressures, however, kept real income flat. On the upside, the annual pace of price increases abated in April, as headline personal consumption expenditure inflation decelerated from 6.6% in March to 6.3% in April.
U.S. - Walking the Inflation-Growth Tightrope
Economic developments for the week point to a U.S. economy that is in transition in financial news. As policymakers try to steer the economy from the current high inflation environment, they must walk a tightrope so as not to inflict too much damage on growth. The second estimate of first quarter GDP suggests that it is indeed a delicate balance that will have to be struck. The economy is now estimated to have contracted by 1.5% through the first three months of 2022, slightly lower than the 1.4% previously reported (see here). The revision mainly reflected lower investment in inventory. On the upside, consumer spending and business investment continued to show strong domestic demand.
On that front, orders for durable goods decelerated in April to 0.4% month-on-month (m/m), from a downwardly revised 0.6% in March. Core capital goods orders, a closely watched proxy for business investment, rose 0.3%. The report suggests that business investment growth is starting to taper as interest rates rise. Manufacturers however have a substantial backlog of orders to fulfill, which should continue to support investment in the near term.
The Fed’s mission to tame inflation is likely to see rates rise even further in financial news. Minutes of the Fed’s May meeting reinforced previous messaging as policymakers discussed getting to a neutral rate expeditiously, as well as the possibility of tightening policy to restrictive levels. Such a move would be dependent on the evolving economic outlook, which is currently shrouded in a great deal of uncertainty. We continue to expect two successive 50 basis point rate increases at the Fed’s June and July meetings.
Rising interest rates are also taking some steam out of the white-hot U.S. housing market. Mortgage rates have risen sharply, and this has resulted in a pullback in buyer demand. Contracts for sales of existing homes (-3.9% m/m) as well as sales of new homes (-16.6% m/m) fell in April – both posting the largest declines since before the pandemic (Chart 1). Prices however continued to trek upwards with the median price for new homes rising 19.6% year-on-year to $450,600. The combination of high prices and rising rates is likely to see the market cool even further as affordability becomes an issue for more and more buyers.

The Congressional Budget Office also released an updated outlook this week and is expecting both inflation and economic growth to cool later this year and into 2023. On a fourth quarter-over-fourth quarter basis, the agency expects the economy to grow by 3.1% in 2022 and by 2.2% and 1.5% in 2023 and 2024 respectively. CPI inflation is projected at 4.7% for 2022, 2.7% for 2023 and 2.3% for 2024. These forecasts were completed prior to further fallout from the Russia-Ukraine war. As such, the inflation numbers are likely to come in higher than predicted.
To cap off the week, nominal income and spending were up in April by 0.4% and 0.9% m/m respectively (see commentary) in financial news. However, due to inflation real disposable income was flat. On the upside, both headline and core personal consumption expenditure (PCE) inflation decelerated in April (Chart 2). Yearly core PCE inflation cooled from 5.2% in March to 4.9%, still well above the Fed’s comfort zone, but moving in the right direction.

Shernette McLeod, Economist | 416-415-0413
This Financial News report is provided by TD Economics. It is for informational and educational purposes only as of the date of writing and may not be appropriate for other purposes. The views and opinions expressed may change at any time based on market or other conditions and may not come to pass. This material is not intended to be relied upon as investment advice or recommendations, does not constitute a solicitation to buy or sell securities and should not be considered specific legal, investment or tax advice. The report does not provide material information about the business and affairs of TD Bank Group and the members of TD Economics are not spokespersons for TD Bank Group with respect to its business and affairs. The information contained in this report has been drawn from sources believed to be reliable but is not guaranteed to be accurate or complete. This report contains economic analysis and views, including about future economic and financial markets performance. These are based on certain assumptions and other factors and are subject to inherent risks and uncertainties. The actual outcome may be materially different. The Toronto-Dominion Bank and its affiliates and related entities that comprise the TD Bank Group are not liable for any errors or omissions in the information, analysis or views contained in this report, or for any loss or damage suffered.
To see more news reports, click here.

Should You Undo Your Retirement and Go Back to Work?
Should You Undo Your Retirement and Go Back to Work? These Questions Might Give You the Answer.
Many retirees have blind spots that could prevent them from seeing why it might make sense to get back to work from retirement, at least part time
A tight labor market and flexible work options in the gig economy would seem to make re-entering the job market from retirement an enticing prospect for retirees. And many are doing just that.
But behavioral economics tells us that there are likely a lot more retirees who would return to the workforce, if only they weren’t held back by cognitive blind spots. These blind spots cause them to ignore the possibility of returning to the workforce—even if working at least part time would make them more satisfied and financially better off.
Are you one of those people? The following self-assessments can help you measure your own vulnerability to these blind spots, and whether you should consider returning to the labor market and try a part-time job.
The value of spare time
Let’s start with a pair of questions on consumer behavior, adapted from research by the behavioral economist Ofer Azar, that measures your willingness to trade time for various discounts:
You found a pen you like for $3. You hear that it is on sale at another store, 20 minutes away. How much cheaper would the pen have to be for you to drive to the other store?
- 50 cents cheaper
- $1 cheaper
- $2 cheaper
- I wouldn’t make the drive if it was free
You found a shirt you like for $30. You hear that it is on sale at another store, 20 minutes away. How much cheaper would the shirt have to be for you to drive to the other store?
- $5 cheaper
- $10 cheaper
- $20 cheaper
- I wouldn’t make the drive even if it was free
The size of the discount you were willing to drive for can help determine how you value your time. For instance, if you’re willing to drive 20 minutes to save $2 on a pen, then you value your time at roughly $6 an hour. That’s less than half of the minimum wage in most states. If you’re willing to drive 20 minutes to save $10 on a shirt, then you value your time at roughly $30 an hour. That might sound like a lot. But consider that, for example, the typical hourly rate for a dog walker on the pet-services site Rover in my neighborhood is $40 an hour.
Time is an asset. Unfortunately, undervaluing your time might also make you less likely to work, since you fail to consider the ways that your time could become a source of income. Retirees who undervalue their time should consider ways that part-time work can translate into real income. Instead of making multiple 20-minute trips to save $30, you might enjoy taking a long walk with a dog that earns you $40. You’re $10 ahead, and you get some exercise.
The power of semiretirement
Here’s the next set of questions, which are drawn from research on dichotomous thinking by psychologist Atsushi Oshio. To what extent do you agree with the following statements?
There are only winners and losers in this world.
- Strongly disagree
- Disagree
- Neutral
- Agree
- Strongly agree
I want to clearly distinguish between what is safe and what is dangerous.
- Strongly disagree
- Disagree
- Neutral
- Agree
- Strongly agree
Information should be defined as either true or false.
- Strongly disagree
- Disagree
- Neutral
- Agree
- Strongly agree
These questions are designed to measure your “binary bias,” which is the tendency to see the world in black-and-white terms. In the 20th century, retirement was mostly a binary choice: You worked full time or you didn’t work at all. There were limited opportunities for retirees to work part time. Now, the gig economy offers older individuals a range of work options, in terms of both the work itself and the number of hours you can work.
Unfortunately, too many older individuals are still stuck in the 20th-century work mind-set. If you answered “Agree” or “Strongly agree” to the questions above, your binary bias might lead you to neglect part-time work opportunities that can boost both your income and your overall well-being. For retirees looking to overcome this bias, it might be helpful to start off small: Look for a paid activity that you only need to do once a week, or an hour or two a day. By starting off this way, you are more likely to stop viewing working as an all-or-nothing option.
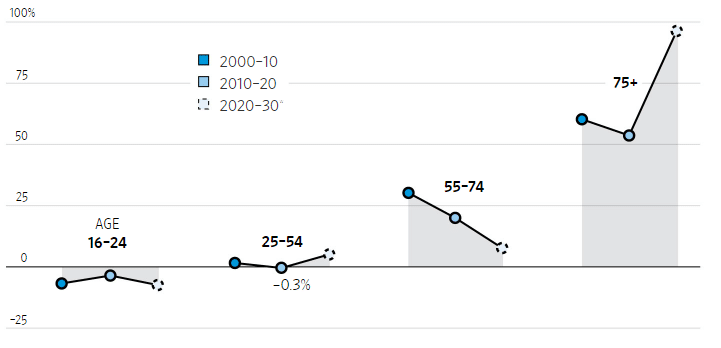
Rise and Decline
Percent change in the civilian labor force, by age
Test-driving your retirement
Here is the last question, which draws from psychological research on our assumptions about happiness.
Imagine someone similar to you in age and personality. Do you think this person would be more satisfied with their life if they lived in the Midwest or California?
- Midwest
- California
- Same

Financial News for the Week of May 13th, 2022
FINANCIAL NEWS HIGHLIGHTS OF THE WEEK
- US retail sales rose by 0.9% m/m, while the control group grew by a stronger 1% m/m. Revisions to the month prior were also positive, suggesting Q1 spending ended the quarter on a firmer footing.
- Home sales fell by 2.6% m/m to 5.6M units in April, as deteriorating affordability continues to weigh on demand. Housing starts (-0.2% m/m) also recorded a modest decline but remain at a healthy 1.7M units.
- Inflation continued to accelerate across the G-7 into April as the effects of rising food and energy prices continue to be felt.
- Moving forward, higher interest rates and reduced real disposable incomes will weigh on demand and help to cool inflation by narrowing the wedge between demand and supply.
U.S. -Spending Through the Pain
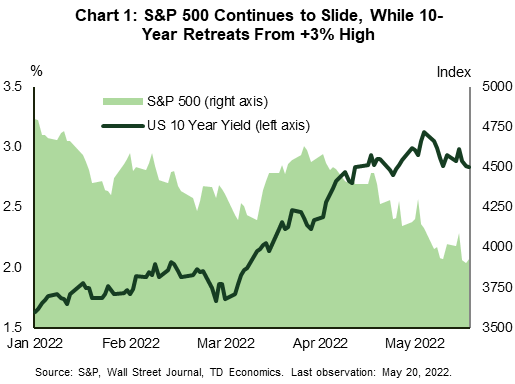
US equities extended one of their worst losing streaks since 2008 this week, having now recorded seven consecutive weeks of declines in financial news. At the time of writing, the S&P 500 is down 2% on the week, and a far greater 18% year-to-date. The selloff in stocks fueled a rally in US treasuries, pushing the 10-year yield down by 10 basis points to 2.83% (Chart 1).
Sentiment soured early in the week as U.S. brick-and-mortar retailers drastically cut future earnings expectations. The common theme was that they are struggling with higher inflation, wages pressures and rising freight costs, all of which are cutting into profits. The dour reaction from financial markets appears to be rooted in the growing concern that the US economy is on the verge of a recession. Investors interpreted the disappointing earnings as a sign that consumers are already on a more precarious footing, further fanning the recession rhetoric. We see things a bit differently.
For starters, many of these big box retailers operate in an environment where margins have always been relatively thin. Even in “normal times”, their ability to pass-on higher costs to consumers is quite limited given the competitive nature of the retail landscape. This problem has been heightened of late, as retailers moved to replenish severely depleted inventories late last year even as consumer demand was already pivoting from goods in favor of services. Retailers were left holding significant inventory, forcing them to discount some merchandise, cutting further into profits.
Retail sales data for April corroborate the notion that consumer spending remains healthy. Headline sales were up 0.9% month-on-month (m/m), while the control measure was up an even stronger 1% m/m. Removing the effects of inflation from the control group did little to change the story, as real sales rose by a healthy 0.9% m/m. Revisions to the prior month were also positive, suggesting consumer expenditures ended last quarter on a much firmer footing than previously thought. While spending is expected to remain robust over the near-term, the combination of higher interest rates and persistent inflationary pressures will present a material headwind in the second half of this year and into 2023. Spending is expected to moderate to a sub-2% pace, though remain supportive of underlying economic growth.
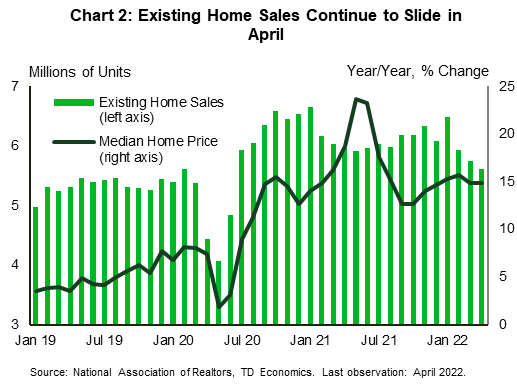
Outside of consumer spending, higher interest rates continue to weigh on housing demand. Existing home sales fell for the third consecutive month in April, falling by 2.4% m/m to 5.6M units (Chart 2). Inventory remained incredibly tight, though the pullback in sales did allow supply to nudge a touch higher to 2.2 months – from 2 months in March. Even still, the market remains undersupplied, which is helping to sustain double-digit price growth of 14.8% y/y.
Housing supply relief is coming, but it is taking longer than expected to come to market in other financial news. Despite recording a modest pullback in April, housing starts remained at a healthy 1.7 million units, while permitting activity continues to point to further gains in construction activity in the months ahead. The combination of softening demand and increased supply should go a long way in rebalancing the market over the coming months, and better align price growth to underlying fundamentals.
Thomas Feltmate, Director | 416- 944-5730
Global- Energy Prices Eat into Buying Power
It's inflation week in the G-7 as the European Union, the U.K., Canada, and Japan all released detailed April inflation numbers. The U.K. made headlines as the consumer price index (CPI) measure reached an eye-watering 9.0% year-over-year (y/y) – the broader measure that includes home ownership services advanced by a more modest 7.8%. Even in Japan inflation hit a seven and a half year high as headline CPI growth reached 2.5%. In general, the surge in energy prices is the rising tide that is lifting the cost of living at a multi-decade high pace.
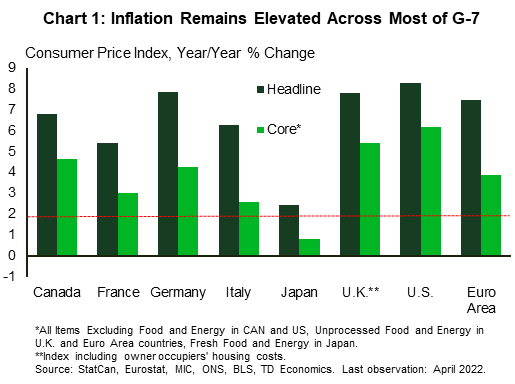
Headline CPI for April in the euro area was 7.3% y/y, while the measure excluding food and energy moved to 3.8%. By comparison, the U.S. registered 8.3% headline and 6.2% core advances, while Canada's release this week showed a 6.8 % and 4.6% increase (Chart 1). The magnitude of the energy shock Europe is witnessing now can't be understated. Energy prices are up 37.5% y/y, 7.3 percentage points ahead of the U.S. and a whopping 11.1 percentage points more than Canada. In the U.K., April saw the semi-annual adjustment to price caps on retail energy products. The cap increase produces abrupt jumps in energy costs followed by relative lulls (like a staircase) that ultimately tracks with the smoother European price profile (Chart 2).

That said, core measures (excluding food and energy) of inflation in most of the G-7 countries are well ahead of policymakers' targets. This reflects demand continuing to outstrip supply as the global economy reckons with a sequence of supply-side shocks.
As inflation continues to accelerate central bankers are concerned about longer-term inflation expectations rising and the entrenchment of a wage-price spiral in financial news. That's a key part of the reason why they continue to signal more monetary tightening despite the risk of a slowdown in growth.
Higher interest rates will work to weaken demand growth, albeit with a lag. The effect of inflation on purchasing power will be more immediate. Measures of wages in the U.K. and Europe are not keeping up with inflation. Average weekly earnings in the U.K. (adjusting for purchasing power) are up 3.5% y/y but, when bonuses are excluded, underlying real wages are down 2.0%. Euro area measures are released with a significant lag, but collectively bargained pay in Germany and Italy (which generally track underlying wage growth) are also lagging inflation. Notably, real hourly contractual wages in Japan were up 1.3% in March. However, in general, wage growth is not keeping up with inflation, so consumers will either be tapping accumulated savings or scaling back on purchases.
Moving forward, output growth will slow through the latter half of the year as inflation and higher interest rates erode purchasing power and slow expenditures. The softer demand backdrop will also help to cool inflation as the wedge between demand and supply narrows in further financial news.
Andrew Hencic, Senior Economist | 416-944-5307
This Financial News report is provided by TD Economics. It is for informational and educational purposes only as of the date of writing and may not be appropriate for other purposes. The views and opinions expressed may change at any time based on market or other conditions and may not come to pass. This material is not intended to be relied upon as investment advice or recommendations, does not constitute a solicitation to buy or sell securities and should not be considered specific legal, investment or tax advice. The report does not provide material information about the business and affairs of TD Bank Group and the members of TD Economics are not spokespersons for TD Bank Group with respect to its business and affairs. The information contained in this report has been drawn from sources believed to be reliable but is not guaranteed to be accurate or complete. This report contains economic analysis and views, including about future economic and financial markets performance. These are based on certain assumptions and other factors and are subject to inherent risks and uncertainties. The actual outcome may be materially different. The Toronto-Dominion Bank and its affiliates and related entities that comprise the TD Bank Group are not liable for any errors or omissions in the information, analysis or views contained in this report, or for any loss or damage suffered.

Financial News for the Week of May 13th, 2022
FINANCIAL NEWS HIGHLIGHTS OF THE WEEK
- The consumer price index (CPI) report showed that both overall and core price pressures eased a touch in year-over-year terms in April. Overall inflation fell to 8.3% y/y from 8.5% in the month prior, while core inflation fell to 6.2% from 6.5%.
- The producer price index (PPI) report echoed a similar message, with producer prices decelerating modestly in April to 11% y/y, but remaining near March’s record high of 11.5%.
- Signs of a slight tick down in inflation will do little to dissuade the Fed from removing monetary stimulus expeditiously. Despite staging a notable recovery on Friday, the S&P 500 looks to end the week down over 2%
U.S. -Slight Pullback in Inflation Won’t Change Fed’s Mind
The second week of May carried a light economic calendar, with primary data releases continuing to center on inflation in financial news. The consumer price index (CPI) report showed that inflationary pressures eased a bit in April, falling to 8.3% year-on-year (y/y) – down from 8.5% in March (Chart 1). Base effects are likely to have played a favorable role, as price pressures stemming from supply chain disruptions began to manifest in March and April of last year.
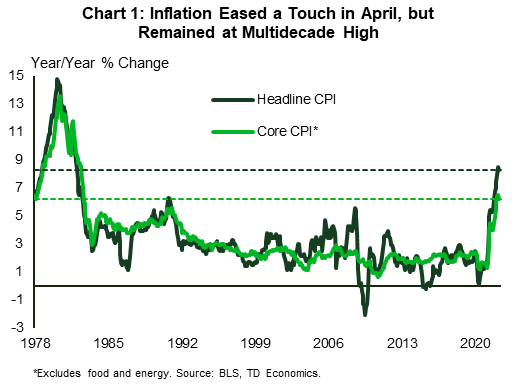
Beneath the headline, food inflation accelerated both in yearly and monthly terms, whereas energy prices eased a touch. Both, however, remain elevated at 9.4% y/y and 30.3% y/y, respectively. Excluding these two volatile categories, core prices also decelerated modestly, falling to 6.2% y/y from 6.5% y/y in March. However, several important categories bucked the trend. On the goods side, new vehicle prices were higher, while medical care, transportation, and shelter were all meaningful contributors on the services side. The transportation category was buoyed from airfares, which continued to rise sharply (18.6% m/m). Meanwhile, market-based measures of strong home price and rent growth suggest that the weighty shelter component has more upside ahead. This, together with the fact that gas prices have resumed their upward climb this month, and that we’re likely to see further upward pressure in food prices from the war in Ukraine, muddy the CPI report’s headline message that inflation may have peaked, making it prudent to wait for further confirmation to this notion in financial news.
The producer price index (PPI) report echoed a similar message to last month’s CPI numbers. Producer prices were up 11% from a year ago in April, marking an easing from an upwardly revised 11.5% y/y in March. Core PPI also eased a touch. That being said, April’s PPI showings, which are not far off from the March record highs, indicate that inflationary pressures continue to build in the production pipeline.
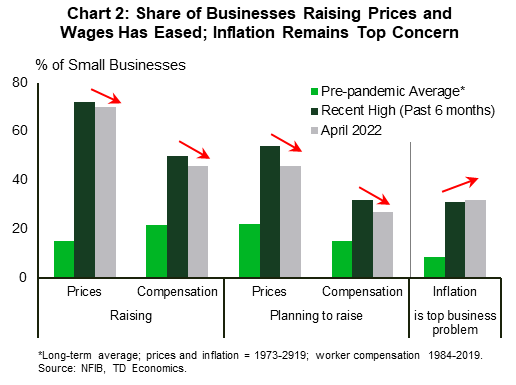
The small business report from the NFIB provided more of the same. In Chart 2 we can see that while the share of businesses raising (and planning to raise) average selling prices and worker compensation have eased from recent highs, they remain well above historical norms. On the other hand, the share of businesses identifying inflation as their top business problem reached a new post-1980 high in April. Another striking feature of the report is the fact that the share of small businesses expecting an improvement in the economy in the months ahead fell to a yet new record low (-50%).
Doubtful expectations about a further improvement in the economy have some basis. Signs of a slight moderation in inflation will do little to dissuade the Fed from removing monetary stimulus expeditiously, which in turn will weigh on economic momentum. In tune with this notion, risk assets continued their downward slide this week. Despite a notable bounce back Friday, the S&P 500 is down 2.6% from last week’s close and roughly 16% from peak. Of course, as Fed Chair Powell noted this week, there’s no guarantee that the Fed will see smooth sailing in its goal to engineer a soft-landing. In a speech Thursday, Chair Powell, who was recently confirmed for a second term, noted that getting inflation back to 2% will cause “some pain”. For now, however, we’re still full ship ahead with another 50-basis point hike in June.
Admir Kolaj, Economist | 416-944-6318
This Financial News report is provided by TD Economics. It is for informational and educational purposes only as of the date of writing and may not be appropriate for other purposes. The views and opinions expressed may change at any time based on market or other conditions and may not come to pass. This material is not intended to be relied upon as investment advice or recommendations, does not constitute a solicitation to buy or sell securities and should not be considered specific legal, investment or tax advice. The report does not provide material information about the business and affairs of TD Bank Group and the members of TD Economics are not spokespersons for TD Bank Group with respect to its business and affairs. The information contained in this report has been drawn from sources believed to be reliable but is not guaranteed to be accurate or complete. This report contains economic analysis and views, including about future economic and financial markets performance. These are based on certain assumptions and other factors and are subject to inherent risks and uncertainties. The actual outcome may be materially different. The Toronto-Dominion Bank and its affiliates and related entities that comprise the TD Bank Group are not liable for any errors or omissions in the information, analysis or views contained in this report, or for any loss or damage suffered.

Financial News for the Week of May 6th, 2022
FINANCIAL NEWS HIGHLIGHTS OF THE WEEK
- The Fed raised the monetary policy rate by 50 basis points for the first time since 2000 and signaled more hikes of the same magnitude are in the works.
- The economy added more jobs than expected in April, but the labor market remains tight with the number of workers looking for jobs retreating.
- Supply constraints continue to create a mismatch between demand and supply. Should supply fail to improve, inflation will remain high, making the Fed’s job more difficult.
U.S. -Tight Corners of the Economy
This was a big week for the U.S. economy with a Federal Reserve interest rate decision and early macroeconomic indicators for the month of April in financial news. As widely anticipated, the Fed raised the monetary policy rate by 50 basis points for the first time since 2000. More tightening is in the works: we anticipate the central bank will hike the fed funds rate in two more 50 basis point moves at its next two meetings. A that point, we expect it to return to more gradual quarter-point adjustments (see Dollars & Sense). Chair Powell’s push back against the possibility of a larger hike was first accepted as bullish by the equity market, but the sentiment reversed quickly pushing the equity market a quarter of a percent lower and bond yields 15 bps higher for the week (at the time of writing).
This morning’s jobs report surprised with 428k jobs added in February, according to the payrolls survey, well above 380k anticipated by forecasters. The unemployment rate, which is measured by the household survey held steady 3.6%. The labor force – a measure of people working or actively looking for work – dropped unexpectedly, pushing the participation rate down to 62.2%. As a result, an already sizeable shortfall relative to the pre-pandemic trend, expanded even further (Chart 1). Without progress on this front, the labor market will remain very tight, providing little relief for businesses already struggling to attract workers.
Meanwhile, leading business indicators – the ISM purchasing managers indexes – came in weaker than expected by the consensus, while remaining in the expansionary territory. The manufacturing sector decelerated for the second month in a row. All major subcomponents but the supplier deliveries index declined, with the largest drop in the employment index. Softness in demand is consistent with our expectation that consumers start to cut back on manufactured products in favor of services. In this context, a deceleration in the services sector was somewhat disappointing. The underlying details suggest that current business activity accelerated, but new orders and new export orders slipped. Another drag was the employment sub-index, which dropped back into the contractionary territory, likely due to “hypercompetitive” demand for workers, as suggested by one of the purchasing managers.
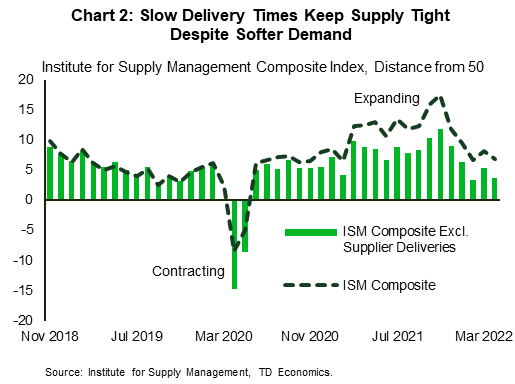
Importantly, supply constraints and challenges in logistics continue to create a mismatch between demand and supply in both sectors of the economy. Comparing to history, the supplier delivery index has been unusually strong since March of 2021, creating a wedge between this sub-component the rest of the index’s drivers (Chart 2). Another way to think about it is that delivery times remain atypically slow relative to softer demand.
Should supply fail to improve in lock steps with demand softening, inflation is likely to remain elevated in financial news. This will make it more difficult for the Fed to soften growth without crushing the economy into a recession. The good news is that the strength of consumer finances points to a softening in spending, rather than an outright retreat (see report). This should help the Fed navigate the economy out of its tight spot.
Maria Solovieva, CFA, Economist | 416-380-1195
This Financial News report is provided by TD Economics. It is for informational and educational purposes only as of the date of writing and may not be appropriate for other purposes. The views and opinions expressed may change at any time based on market or other conditions and may not come to pass. This material is not intended to be relied upon as investment advice or recommendations, does not constitute a solicitation to buy or sell securities and should not be considered specific legal, investment or tax advice. The report does not provide material information about the business and affairs of TD Bank Group and the members of TD Economics are not spokespersons for TD Bank Group with respect to its business and affairs. The information contained in this report has been drawn from sources believed to be reliable but is not guaranteed to be accurate or complete. This report contains economic analysis and views, including about future economic and financial markets performance. These are based on certain assumptions and other factors and are subject to inherent risks and uncertainties. The actual outcome may be materially different. The Toronto-Dominion Bank and its affiliates and related entities that comprise the TD Bank Group are not liable for any errors or omissions in the information, analysis or views contained in this report, or for any loss or damage suffered.

Financial News for the Week of April 29th, 2022
FINANCIAL NEWS HIGHLIGHTS OF THE WEEK
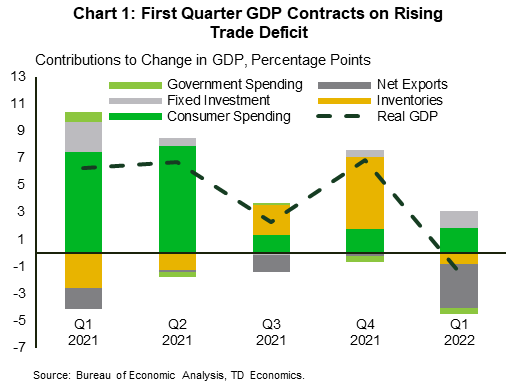
- U.S. economic growth contracted in the first three months of 2022. Real GDP fell 1.4% due largely to a sizeable increase in the trade deficit.
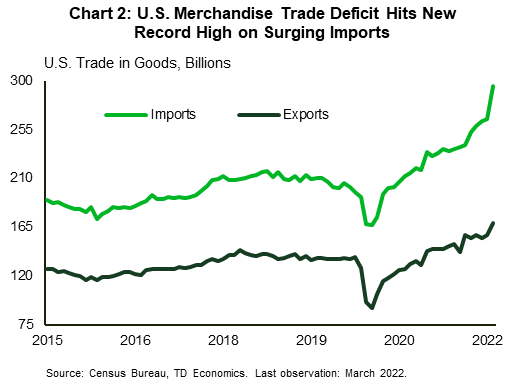
- The U.S. goods trade deficit widened unexpectedly by almost 18% to hit a new record in March, reflecting both higher import volumes and prices.
- Personal income and consumer spending rose on a monthly basis in March. While a key inflation measure, the core PCE deflator, eased marginally to 5.2% year/year from 5.3% in February.
U.S. -GDP Drop Obscures Strong Underlying Demand
First quarter GDP was the disappointing marquee release this week, but there were plenty of silver linings in financial news. The consensus was for weak, but still positive, growth. Instead, the U.S. economy retreated by 1.4% annualized, after booming 6.9% in the fourth quarter of 2021 (see here). The unexpected retrenchment was largely due to a widening trade deficit, with slowing inventory accumulation and fading stimulus spending chipping in (Chart 1). The headline decline masked underlying strength in consumer spending and business investment, which posted solid gains of 2.7% and 9.2% respectively in the quarter.
Business investment has good momentum heading into Q2, with durable goods orders up 0.8% month-on-month (m/m) in March, after a 1.7% decline in February. The increase was driven by autos, computers and other electronics. The measure has risen in five of the last six months. The report also showed that a closely watched proxy for business investment – new orders for nondefense capital goods excluding aircraft – rose by 1% m/m, pointing to resilience in the business sector.
On the housing front, data from the S&P CoreLogic Case-Shiller Index showed that home price growth remained robust in February. Prices posted a 19.8% y/y gain, up from 19.1% in January. This was the highest growth rate since August and reflects extremely low levels of inventory relative to demand. As mortgage rates continue to climb, however, purchasing power will dim, resulting in lowered demand which should restore greater equilibrium to the market.
There are already some indications of this as sales of newly built single-family homes fell in March for the third consecutive month. New home sales were down 8.6% m/m. There was also a decline in contracts signed to purchase homes. Pending home sales headed lower for the fifth consecutive month. The metric fell 1.2% m/m in March, pushing signed contracts to the lowest level since May 2020. As prices and interest rates head higher, and a solid supply of homes under construction are completed, the current imbalance between housing supply and demand should start to close.
There was little sign of improvement in the trade deficit through the quarter, as the monthly deficit hit a new record in March. A surge in imports dwarfed export gains (Chart 2). The goods trade gap rose by 17.8% m/m to $125.3 billion. While strong demand from businesses and consumers lead to a surge in imports, rising prices also contributed to the sizeable increase in the deficit. Front-loading of imports due to geopolitical and supply-chain uncertainty saw sizeable increases in the import of consumer goods (13.6%) and motor vehicles (12%).
Finally, both nominal personal income and spending rose in March by 0.5% and 1.1% m/m respectively (see here) in financial news. Accounting for prices, real spending rose 0.2% on the month. The Fed’s preferred inflation gauge, the core personal consumption expenditure deflator, rose 5.2% y/y, a slight deceleration from February. Add it all up, and with inflation still elevated, and strong momentum in consumer spending and business investment, the Fed is expected to look past the headline decline in GDP, and press full steam ahead with policy normalization, with a 50 basis point hike next week.
Shernette McLeod, Economist | 416-415-0413
This Financial News report is provided by TD Economics. It is for informational and educational purposes only as of the date of writing and may not be appropriate for other purposes. The views and opinions expressed may change at any time based on market or other conditions and may not come to pass. This material is not intended to be relied upon as investment advice or recommendations, does not constitute a solicitation to buy or sell securities and should not be considered specific legal, investment or tax advice. The report does not provide material information about the business and affairs of TD Bank Group and the members of TD Economics are not spokespersons for TD Bank Group with respect to its business and affairs. The information contained in this report has been drawn from sources believed to be reliable but is not guaranteed to be accurate or complete. This report contains economic analysis and views, including about future economic and financial markets performance. These are based on certain assumptions and other factors and are subject to inherent risks and uncertainties. The actual outcome may be materially different. The Toronto-Dominion Bank and its affiliates and related entities that comprise the TD Bank Group are not liable for any errors or omissions in the information, analysis or views contained in this report, or for any loss or damage suffered.

Financial News for the Week of April 22nd, 2022
FINANCIAL NEWS HIGHLIGHTS OF THE WEEK
- US yields continued to move higher this week, as Fed Chair Jerome Powell solidified the case for a 50-basis point rate hike at the Fed’s next meeting on May 4th. He also left the door open to additional 50 bps hikes at subsequent meetings, citing the importance of “front-loading” the removal of monetary accommodation.
- Existing home sales declined by 2.7% m/m to 5.77M (annualized) units in March, while housing starts surprised to the upside, rising by 0.3% m/m to 1.79M (annualized) units.
- The IMF has revised global growth projections lower as the ongoing war in Ukraine and COVID containment efforts in China dim economic prospects.
- Supply chains challenges continue to strain production due to an ongoing scarcity of inputs and rapidly rising costs.
U.S. -Appreciating the Fed Speak
Bond yields across the curve continued to move higher this week, as Fed officials have signaled a growing desire to move quickly in raising rates to quell inflation in financial news. This theme has been playing out across global financial markets since the beginning of the year and was echoed by Fed Chair Jerome Powell earlier this week. Speaking at an IMF event, Powell highlighted the importance of “front-loading” the removal of monetary accommodation, solidifying the case for a 50 basis-point rate hike.
The combination of firming rate hike expectations and heightened geopolitical tensions have led to a meaningful appreciation in the US dollar vis-à-vis other majors. Since the beginning of the year, the dollar index has appreciated by over 5%. It currently sits at a level not seen since the onset of the pandemic when heighten uncertainty drove significant safe haven flows into the US. With that in mind, it doesn’t seem like the dollar has much further to run. Longer-term yields are quickly closing in on peak levels not seen since the end of the last tightening cycle, and markets are already fully priced for an additional 200 basis points (bps) of tightening from the Fed this year alone. This is 25 bps higher than the FOMC’s median projection for the fed funds rate, suggesting there’s still some wiggle room for the Fed to adjust its outlook higher without meaningful moving the market. The wildcard remains on the geopolitical front. Further escalations in geopolitical tensions will only drive stronger demand for safe-haven investments, which would ultimately be dollar positive.
On the real economy, we’ve already started to see the impact of higher rates on some interest rate sensitive sectors. Existing home sales declined by 2.7% m/m in March – falling for the second consecutive month – to 5.77M units (Chart 1). However, higher rates aren’t telling the full story. Sales have also been restrained by exceptionally tight inventory, which currently sits at just a 2 months’ supply. For context, a balanced market typically runs anywhere between 4-6 months’ supply. While we are a long way from those levels, housing construction continues to surprise to the upside.
March housing starts rose by 0.3% month-on-month (m/m) to 1.79M (SAAR) units, marking yet another new cyclical high. Over the near-term, it would appear that starts have more room to run. The 3-month moving average of housing permits – a leading indicator for construction – continues to run well above the current level of starts, suggesting there is still plenty of projects in the pipeline.

The sustained strength in housing construction provides evidence that at least some of the headwinds that builders had faced earlier in the pandemic are starting to abate. Also in financial news, while sourcing of some materials remains an issue, labor constraints appear to be easing. Over the last year, the construction sector has added more than 200k jobs, and has now completely recouped all of its pandemic related losses. Interestingly, gains have not been spread evenly across the sector. Hiring in residential construction is 5.5% above February 2020 levels, while non-residential construction still has yet to recover from the pandemic. The shifting in employment composition shows that trades workers are going where the jobs are most plentiful, which bodes well for continued strength in residential construction, and should provide some relief to the supply constrained housing market.
Thomas Feltmate, Director | 647-983-5499
This Financial News report is provided by TD Economics. It is for informational and educational purposes only as of the date of writing and may not be appropriate for other purposes. The views and opinions expressed may change at any time based on market or other conditions and may not come to pass. This material is not intended to be relied upon as investment advice or recommendations, does not constitute a solicitation to buy or sell securities and should not be considered specific legal, investment or tax advice. The report does not provide material information about the business and affairs of TD Bank Group and the members of TD Economics are not spokespersons for TD Bank Group with respect to its business and affairs. The information contained in this report has been drawn from sources believed to be reliable but is not guaranteed to be accurate or complete. This report contains economic analysis and views, including about future economic and financial markets performance. These are based on certain assumptions and other factors and are subject to inherent risks and uncertainties. The actual outcome may be materially different. The Toronto-Dominion Bank and its affiliates and related entities that comprise the TD Bank Group are not liable for any errors or omissions in the information, analysis or views contained in this report, or for any loss or damage suffered.

Financial News for the Week of April 15th, 2022
FINANCIAL NEWS HIGHLIGHTS OF THE WEEK
- Overall inflation as measured by the CPI accelerated to 8.5% year-over-year (y/y) in March, marking yet another multi-decade high. Core inflation, which excludes food and energy, ticked up a tenth of a percentage point to 6.5% y/y.
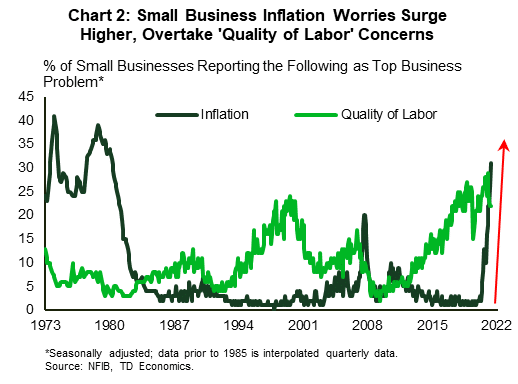
- Small business confidence continued to trend lower in March as the share of businesses expecting an improvement in the economy fell to an all-time low. Meanwhile, inflation has vaulted into being perceived as the top business problem.
- Retail sales rose 0.5% month-to-month (m/m) in March - broadly in line with market expectations. Excluding volatile categories, sales in the ‘control group’ (used in calculating personal consumption expenditures) fell 0.1% on the month.
U.S. -Inflation Surge Continues
Inflation remained top of mind this week with the Consumer Price Index (CPI) report reminding us once again that price pressures accelerated in March in financial news. Overall inflation rose both in month-to-month (+1.2% m/m) and year-over-year (y/y) terms, with the latter reaching 8.5% in March – a new multi-decade high. Energy, especially, and food, to a lesser degree, both contributed to the acceleration. Still, even when excluding these more volatile categories, core inflation (up only a tenth of a percentage point to 6.5% y/y) was at the highest level since the early 1980s (Chart 1). Adding to the evidence that price pressures continued to build through March, supplier prices also rose sharply last month, accelerating to 11.2% y/y – an all-time high for the data stretching back to 2010.
Inflation worries were echoed in the National Federation of Independent Business (NFIB) small business report. Business confidence continued to trend lower, falling to 93.2 in March – the lowest level since 2016 excluding the temporary drop at the start of the pandemic. Businesses were the most pessimistic they have ever been regarding an improvement in the economy ahead from current levels (albeit the bar to improve on the post-pandemic rebound pace is very high). Yet perhaps the most striking aspect of the report is the fact that inflation concerns, barely a factor as the start of last year, have risen sharply, overtaking ‘quality of labor’ concerns recently (Chart 2). This shift suggests that managing inflation’s impact is now the top priority, while securing talent amidst a tightening labor market playing an important second fiddle.
Small business job openings remain plentiful, despite trending lower since peaking in September. Meanwhile, businesses continue to raise wages and plan more increases ahead, with both of these sub-indicators in the NFIB survey ticking higher last month. A growing share of businesses are also passing on the added costs to consumers by raising prices. A net 72% are doing so – a record high in the survey’s almost 50-year history. All these factors, together with the potential for more supply-chain disruptions due to the war in Ukraine, and shutdowns in China, suggest that inflation will continue to run hot in the near-term.
Tilting to retail sales, a 0.5% gain in March and a bulky upgrade to the month prior were positive developments. Gains in March also appeared to be skewed toward “going out” categories – a pattern consistent with the reopening of the economy. A sharp drop in non-store sales (a proxy for online sales) further bolsters this point. Digging deeper, however, the picture is less rosy. Sales in the control group, which exclude volatile categories and are used in calculating personal consumption expenditures, were down 0.1% m/m. Meanwhile, when adjusting headline figures by CPI, the data points a decline in the ‘real’ sales estimate both in monthly and year-on-year terms.
All told, with inflation running hot and still no major cracks in the economic armor, the Fed will need to follow through with the speedy removal of monetary stimulus to try and rein in inflation. Interest-sensitive sectors, such as housing, which is already showing some signs of cooling (see here), are first on the list to feel the pinch from the higher rate environment.
Admir Kolaj, Economist | 416-944-6318
This Financial News report is provided by TD Economics. It is for informational and educational purposes only as of the date of writing and may not be appropriate for other purposes. The views and opinions expressed may change at any time based on market or other conditions and may not come to pass. This material is not intended to be relied upon as investment advice or recommendations, does not constitute a solicitation to buy or sell securities and should not be considered specific legal, investment or tax advice. The report does not provide material information about the business and affairs of TD Bank Group and the members of TD Economics are not spokespersons for TD Bank Group with respect to its business and affairs. The information contained in this report has been drawn from sources believed to be reliable but is not guaranteed to be accurate or complete. This report contains economic analysis and views, including about future economic and financial markets performance. These are based on certain assumptions and other factors and are subject to inherent risks and uncertainties. The actual outcome may be materially different. The Toronto-Dominion Bank and its affiliates and related entities that comprise the TD Bank Group are not liable for any errors or omissions in the information, analysis or views contained in this report, or for any loss or damage suffered.

Financial News for the Week of April 8th, 2022
FINANCIAL NEWS HIGHLIGHTS OF THE WEEK
- The first full week of the second quarter was sparse on economic data. The service sector showed signs of modest acceleration, while vehicle sales declined for the second consecutive month in March.
- The Federal Open Market Committee (FOMC) March meeting minutes reiterated members’ unwavering commitment to moving fast to restore price stability.
- The minutes provided a blueprint of the Fed’s balance sheet runoff, which will be more aggressive and ramp up faster than before. At such pace, the runoff should finish by the end of 2024.
U.S. -The Fed’s Most Important Task
The first full week of the second quarter was sparse on economic data in financial news. On Tuesday, the Institute for Supply Management released its report on services that provided signs of modest acceleration in economic activity in the sector. Still, the report was full of contrasting elements. On the one hand, demand indicators were higher with business activity, and both new domestic and export orders up on the month. This was likely supported by stronger employment and the recent improvement in delivery times allowing businesses to rebuild depleted inventories.
On the other hand, the imports sub-index fell into a contractionary territory while ongoing supply chain issued lowered purchasing managers’ inventory sentiment to an all-time low. The prices paid indicator was unsurprisingly higher given the energy shock dealt by the Russia-Ukraine war with all 18 industries reporting higher prices (Chart 1). In addition, respondents’ comments were quite negative, reflecting the pessimism over increasing cost and ongoing supply chain disruption.

This pessimism was echoed in the vehicle sales release, which showed the second consecutive month of decline in March. While underlying demand remains strong and improving, sales will remain constrained by limited inventory. Furthermore, production may suffer another blow should the war in Ukraine result in semiconductor shortages later in this year. As a result of strong demand and tight supply, the inventory-to-sales ratio – a measure of adequacy of supply relative to current demand – remains historically low. This will continue to put upward pressure on car prices over the near-term.
Fighting persistent price pressures remains the Fed’s most important task. The Federal Open Market Committee (FOMC) March meeting minutes reiterated members’’ unwavering commitment to moving fast to restore price stability and reach a neutral policy stance by year end. Many participants expressed their concerns about inflationary risk and voiced their preference to tighten the policy rate by 50 basis points at the next meeting on May 3rd-4th.
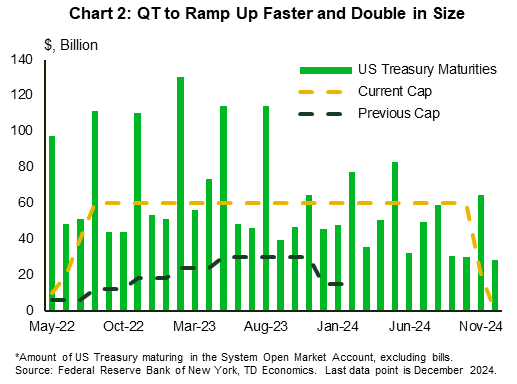
The minutes also provided a plan for the Fed’s balance sheet runoff (aka Quantitative Tightening or QT). As we wrote in this report, the monthly caps will be larger than in the previous QT cycle, scaled up by the increase in asset holdings (Chart 2). The participants agreed to shed $60 billion Treasury securities and about $35 billion agency MBS monthly, but the phase-in period will be shorter than we expected at just three months. The runoff may start as early as May, which suggests that the balance sheet could shrink by $2.7 trillion by the end of 2024. By this time, we expect that the Fed will reach $1.7 trillion in reserves – the level of reserves “consistent with the Committee’s ample-reserves operating framework”.
Bond markets reacted by selling longer-dated US Treasury securities, which led to yield-curve steepening. At the time of writing, the 10-year Treasury yield was at 2.69% - up 0.3 percentage points relative to where it closed last week.
Maria Solovieva, CFA, Economist | 416-380-1195
This Financial News report is provided by TD Economics. It is for informational and educational purposes only as of the date of writing and may not be appropriate for other purposes. The views and opinions expressed may change at any time based on market or other conditions and may not come to pass. This material is not intended to be relied upon as investment advice or recommendations, does not constitute a solicitation to buy or sell securities and should not be considered specific legal, investment or tax advice. The report does not provide material information about the business and affairs of TD Bank Group and the members of TD Economics are not spokespersons for TD Bank Group with respect to its business and affairs. The information contained in this report has been drawn from sources believed to be reliable but is not guaranteed to be accurate or complete. This report contains economic analysis and views, including about future economic and financial markets performance. These are based on certain assumptions and other factors and are subject to inherent risks and uncertainties. The actual outcome may be materially different. The Toronto-Dominion Bank and its affiliates and related entities that comprise the TD Bank Group are not liable for any errors or omissions in the information, analysis or views contained in this report, or for any loss or damage suffered.